Work with queries in ADQM Control
The Queries page in the ADQM Control web interface displays SQL queries executed in ADQM clusters connected to the monitoring system. On this page, you can get an overview of queries to cluster databases and view various query execution metrics — for example, to analyze query performance, amounts of read/written data, resource usage, errors if they have occurred during query execution, etc.
At the top of the screen, you can set up the following filters to select which data the Queries page should display:
-
Cluster — ADQM cluster where queries were executed.
-
Time — time period when queries were launched. In the window that opens when you click the field, you can select an interval from the offered options on the Range tab or set a custom time range (at least 1 hour) on the Calendar tab.
-
Refresh — frequency of data updates.
Query history is always displayed on the Queries page according to these filters — it contains all queries run on the selected ADQM cluster during the specified time period. For each DDL query (with ON CLUSTER), it also includes the queries executed on each host of the cluster and displays the /* ddl_entry=query-num */ prefix before the main text of such queries.
You can also get a list of the longest-running queries or queries used the most memory in the Top 10 queries section on the Dashboard page.
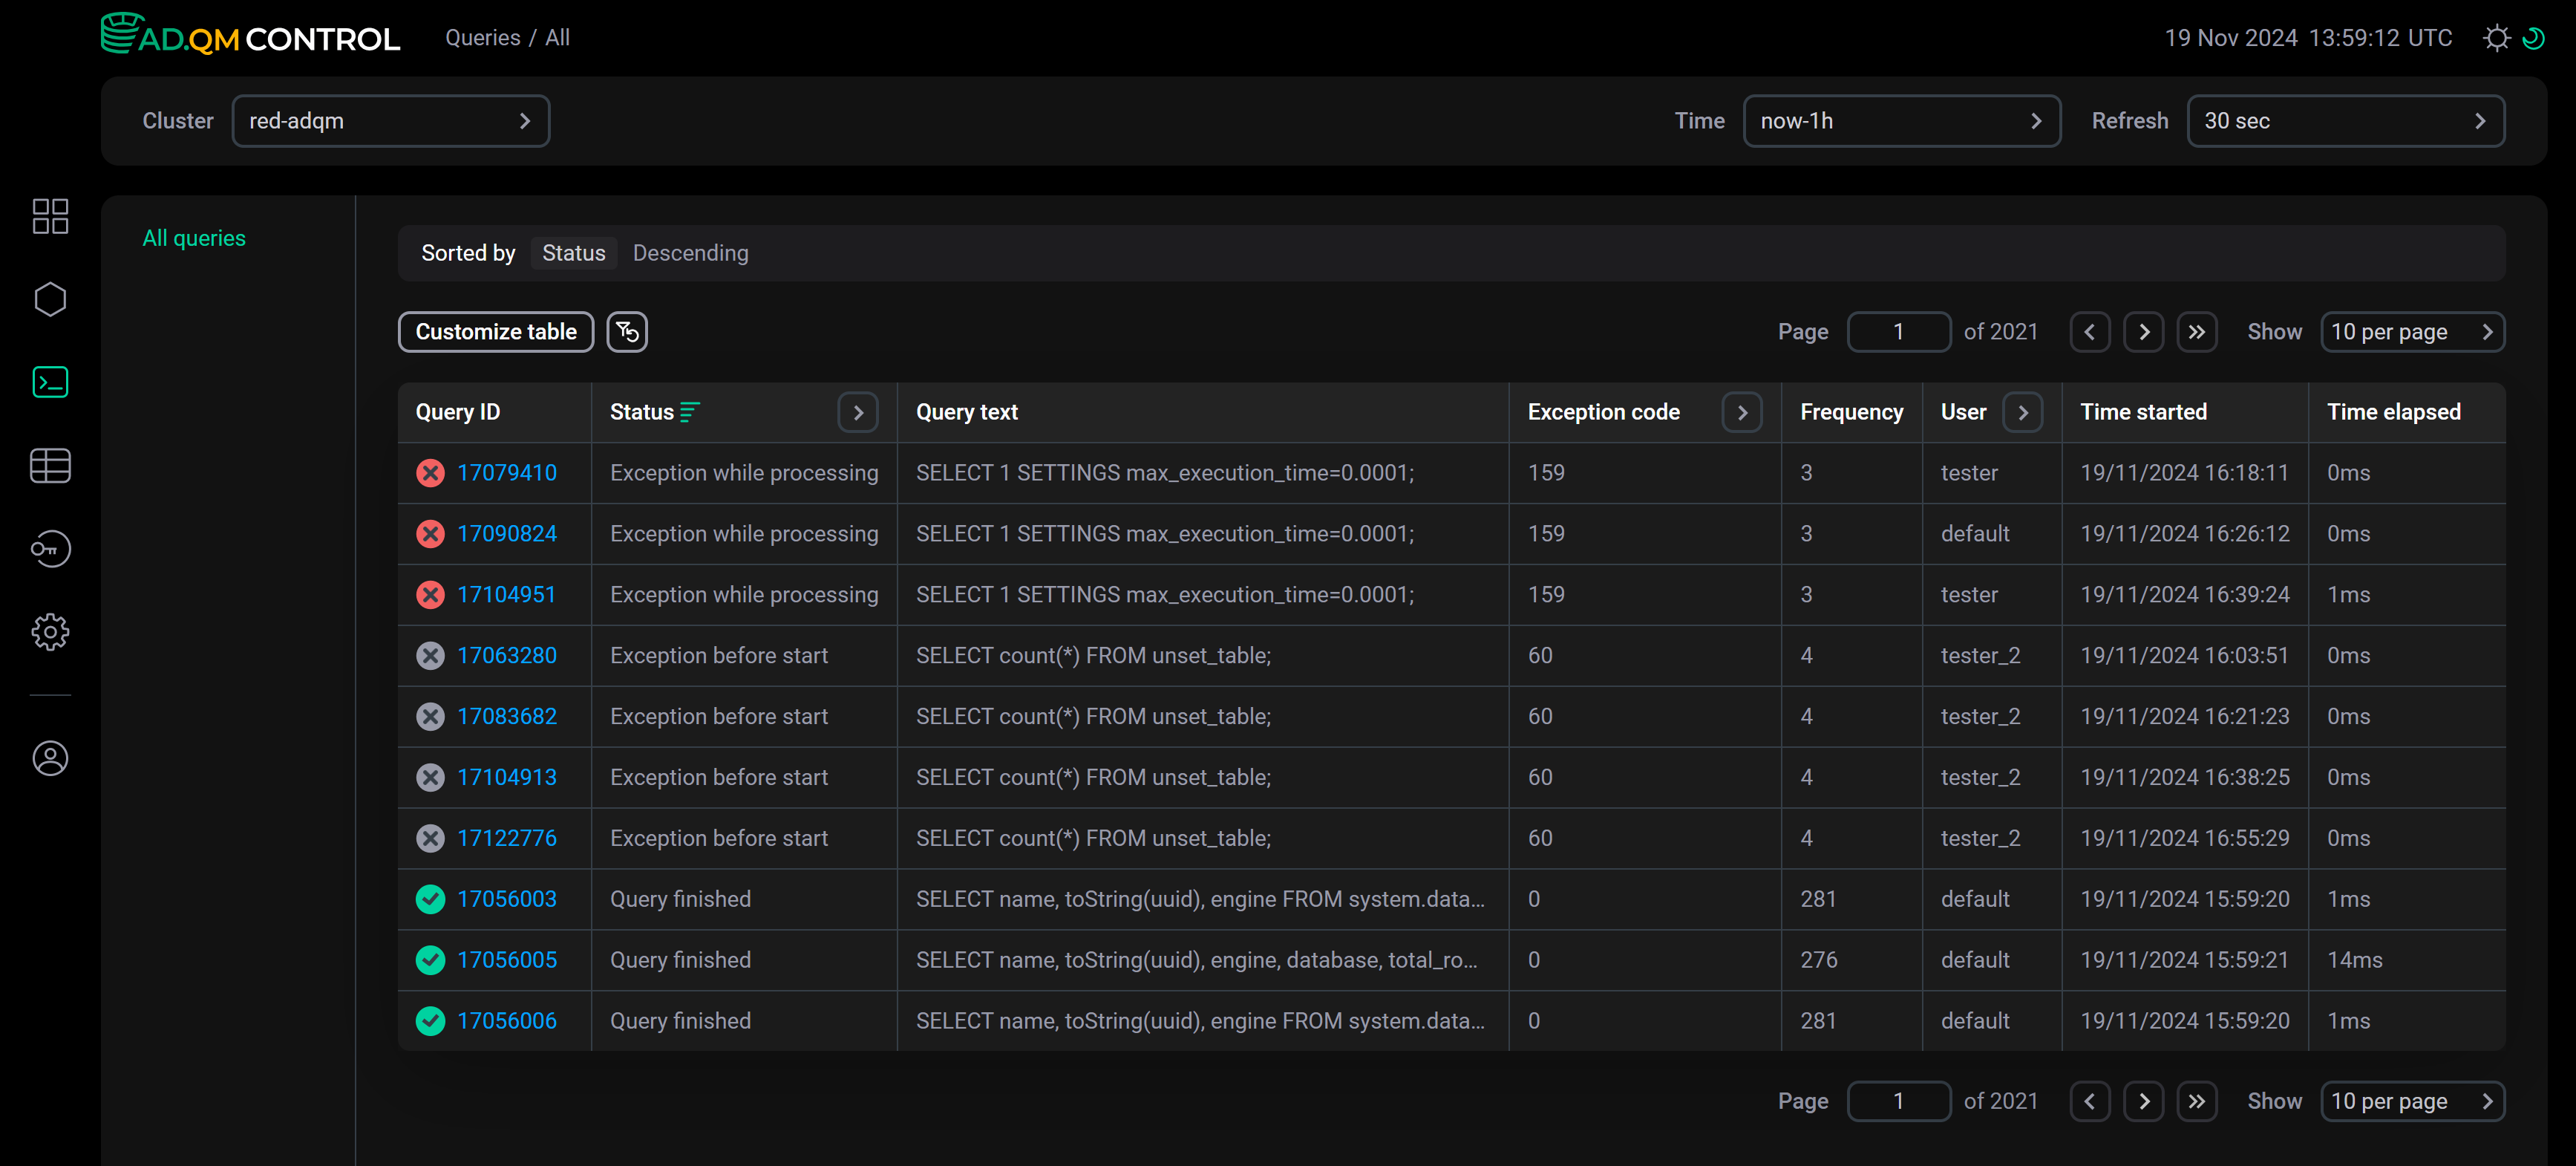
Fields of the Queries table
The table with the list of queries on the Queries page can include the following fields.
| Field | Description |
|---|---|
Query ID |
Unique query identifier. The column also shows an icon indicating the query status:
Query status can also be separately displayed in the Status column that allows filtering and sorting |
Query text |
Query text. For a long query, its text is truncated and when you hover the mouse cursor over the column cell, it is displayed as |
Status |
Current status of a query. Possible values:
|
Host |
Host where a query was run |
Exception |
Text of an error occurred before or during a query execution |
Exception code |
Code of an error occurred before or during a query execution |
Frequency |
How many times a query was executed in the cluster during the selected time period in the context of all filters currently applied on the page. Statistics are calculated for queries whose text completely matches (i.e. for parameterized queries, specific parameter values are taken into account) |
Databases |
Names of databases accessed by a query (there may be multiple — for example, if a query uses JOIN) |
Tables |
Names of tables accessed by a query (there may be multiple — for example, if a query uses JOIN) |
Used memory |
Amount of memory consumed by a query |
User |
Name of an ADQM user who initiated a query execution |
Time started |
Query execution start time |
Time elapsed |
Duration of a query execution or the current execution time ( |
Average execution time |
Average query execution time. Statistics are calculated for queries whose text completely matches (i.e. for parameterized queries, specific parameter values are taken into account) |
Read bytes |
Total amount of data read from all tables and table functions participated in a query. For distributed queries, this is the number of bytes read on all replicas — each replica sends its |
Result bytes |
Amount of memory to store a query result |
Result rows |
Number of rows in the result of a |
Read rows |
Total number of rows read from all tables and table functions participated in a query. For distributed queries, this is the total number of rows read on all replicas — each replica sends its |
Written rows |
Number of rows written by an |
Written bytes |
Amount of data written by an |
Type |
Query type. Possible values:
|


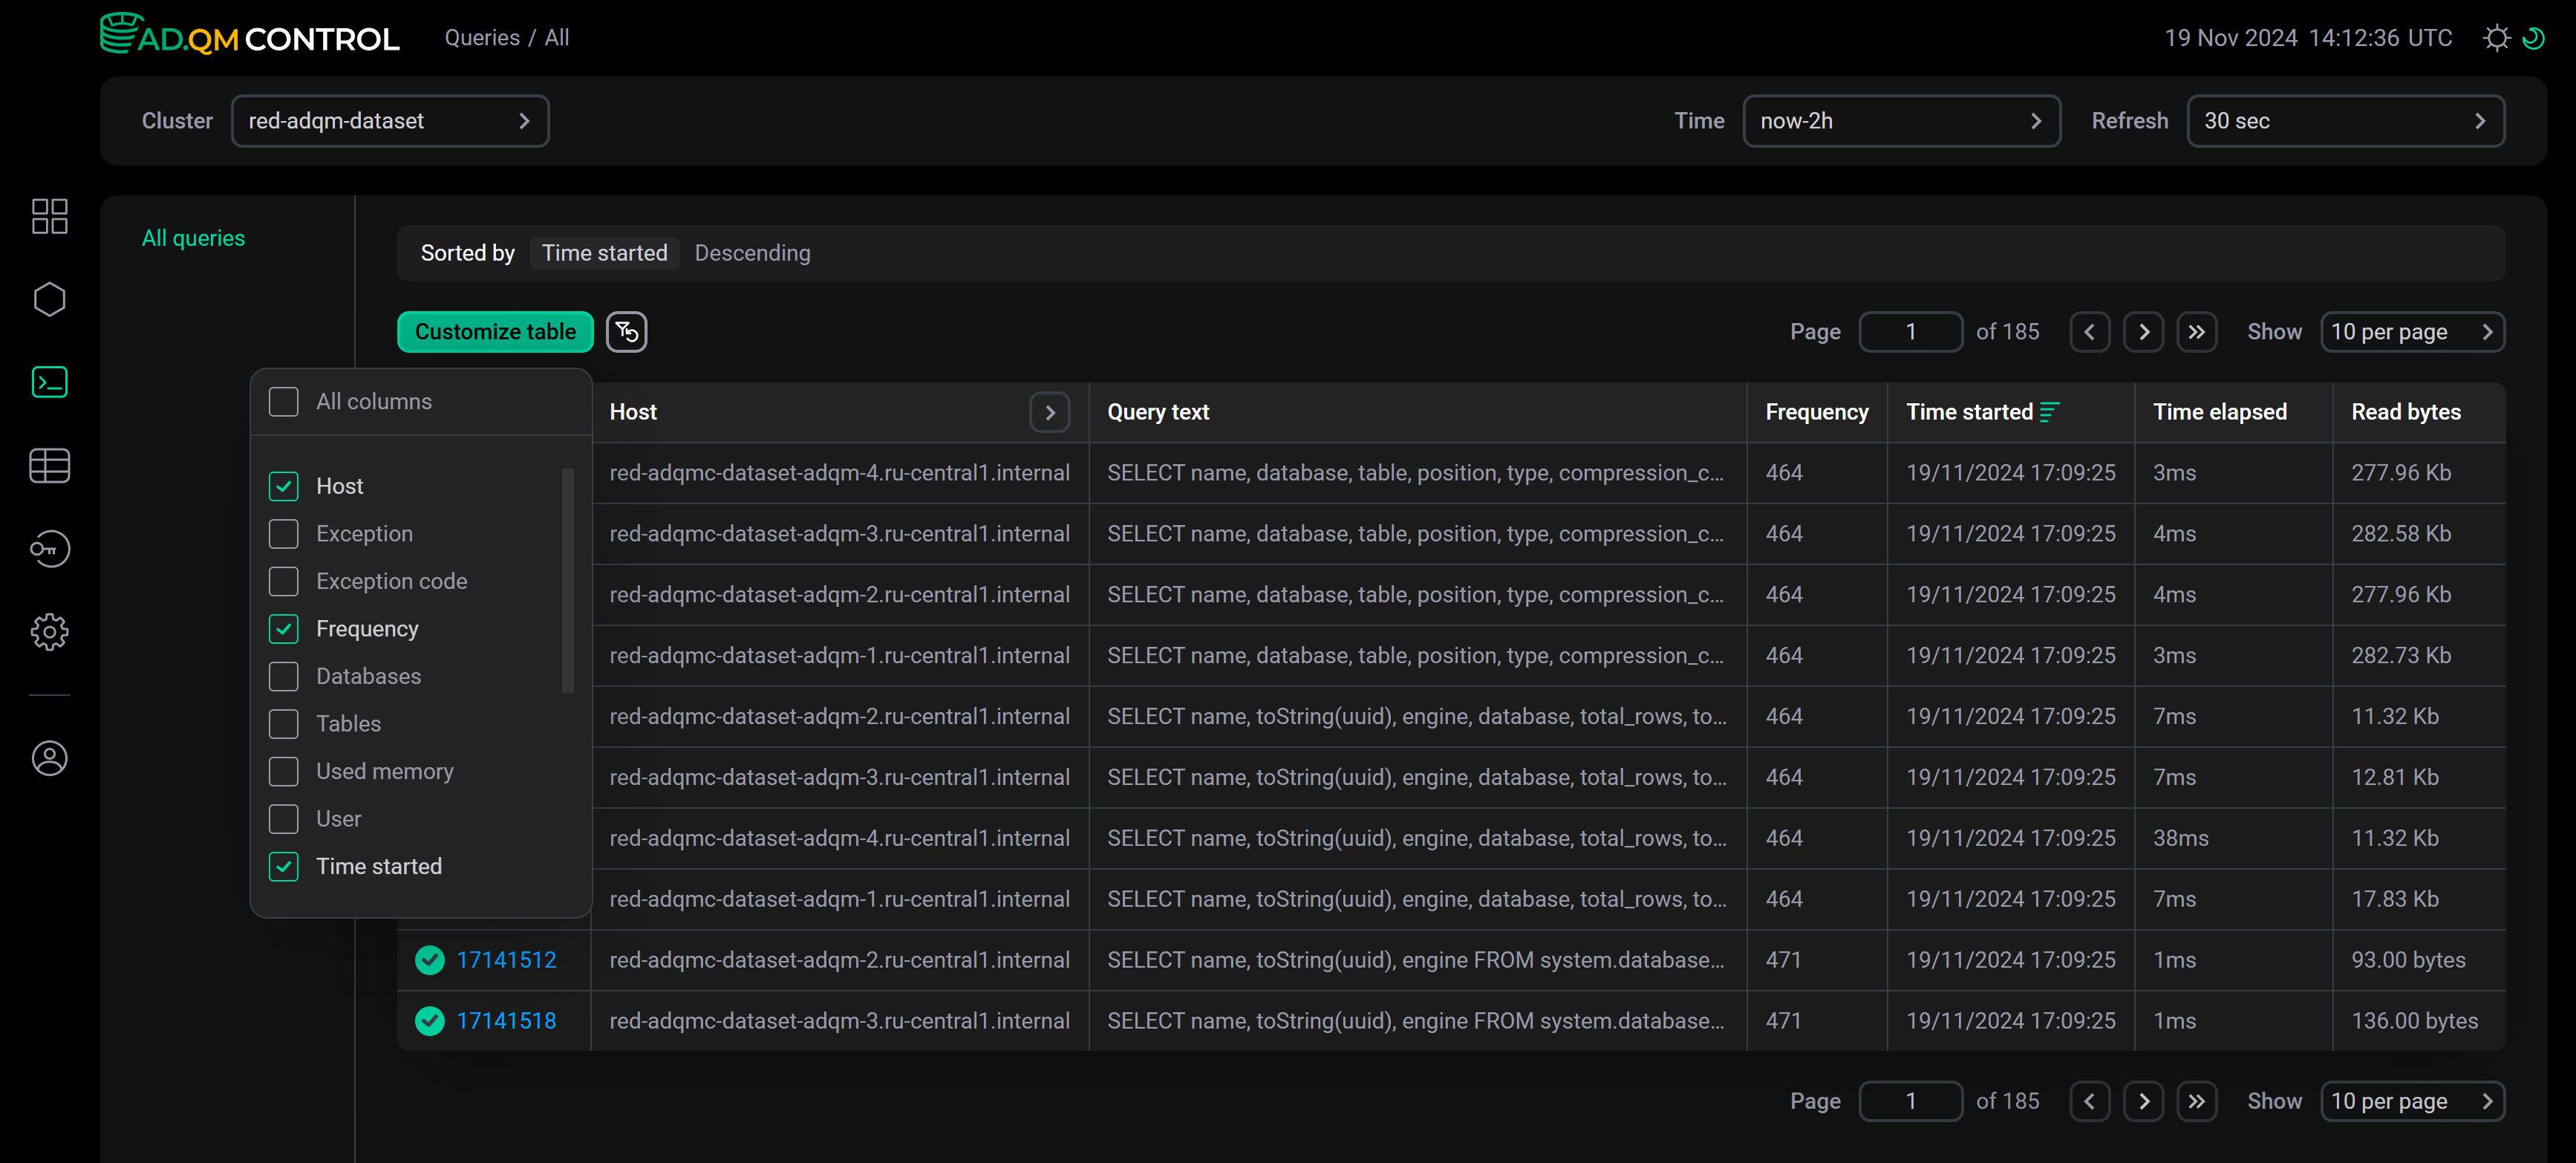
To display/hide fields of the Queries table, click Customize table and select the desired fields in the drop-down list. The Query ID and Query text fields are always visible, they cannot be hidden.
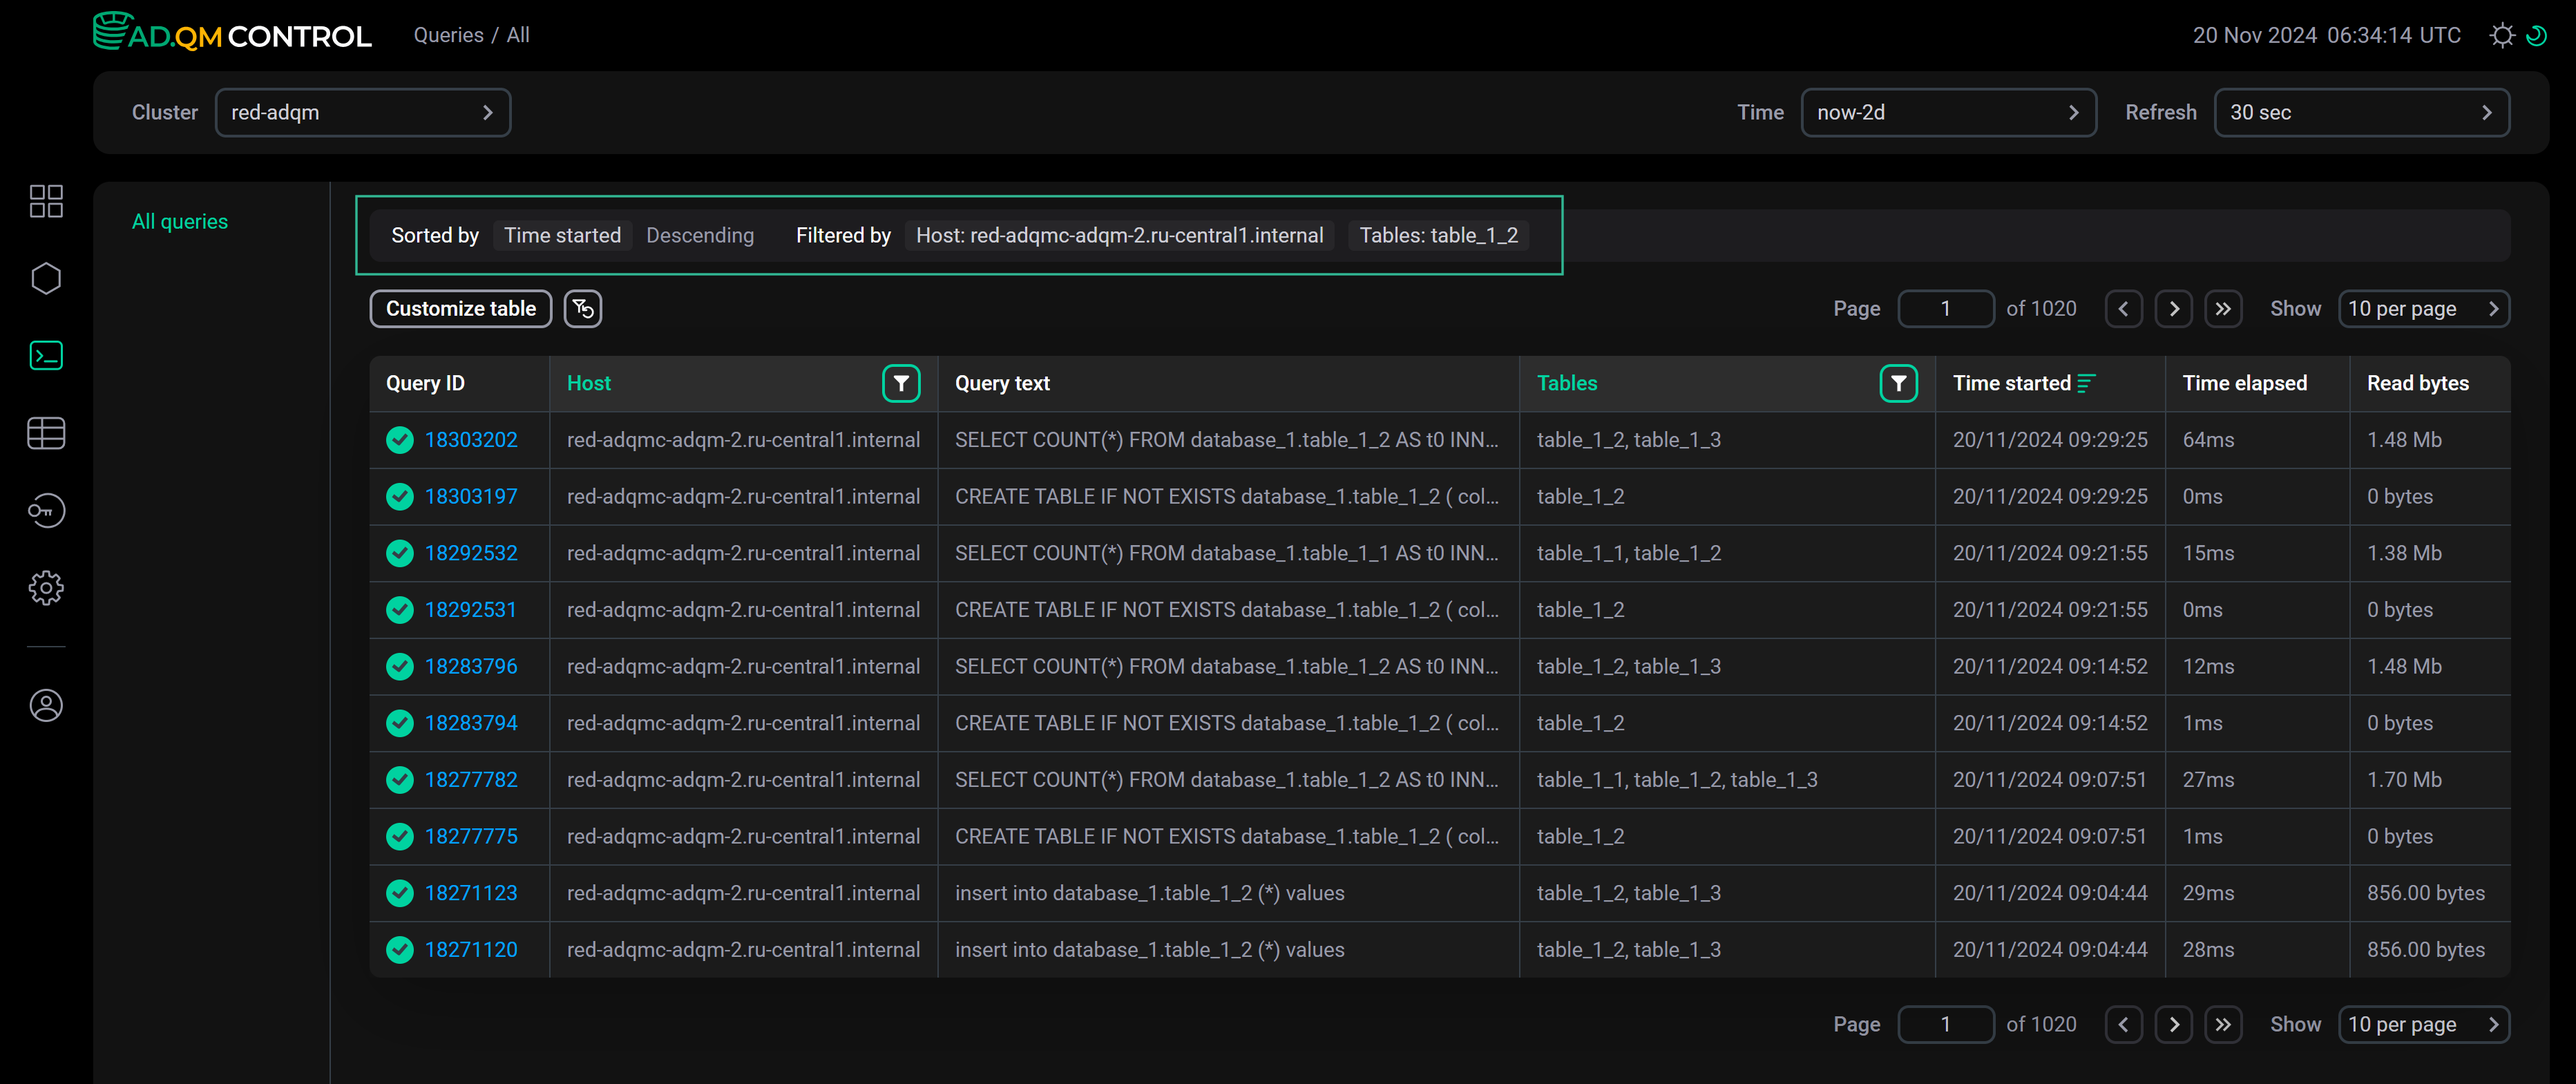
Sort and filter data
In the column headers of the table with the list of queries, there are filters that you can use to select specific data. To open a filter, click the icon ![]()
![]() . Filters are available in the following columns:
. Filters are available in the following columns:
-
Host, Databases, Tables — enter a name of a host, database, or table (for rows with multiple databases or tables separated by commas in the Databases or Tables column, filtering works only if the search is performed by one item from a list of databases or tables in a cell);
-
Exception code — enter a numerical error code;
-
User — you can enter a name or name fragment of a user;
-
Status, Type — you can select a value (query status or type) from the drop-down list.
The icon ![]()
![]() indicates that a filter by column values is applied. To reset all filter conditions, click
indicates that a filter by column values is applied. To reset all filter conditions, click ![]()
![]() .
.
Data sorting is available in the following columns: Exception (actually sorting is performed by error code), Exception code, Used memory, Time started, Time elapsed, Read bytes, Result bytes, Result rows, Read rows, Written rows, and Written bytes. To change a sort order by column values, use the icon ![]()
![]() or
or ![]()
![]() in the column header.
in the column header.
Above the table with queries, there is a panel that shows the sorting (Sorted by) and filtering (Filtered by) conditions currently applied to data.
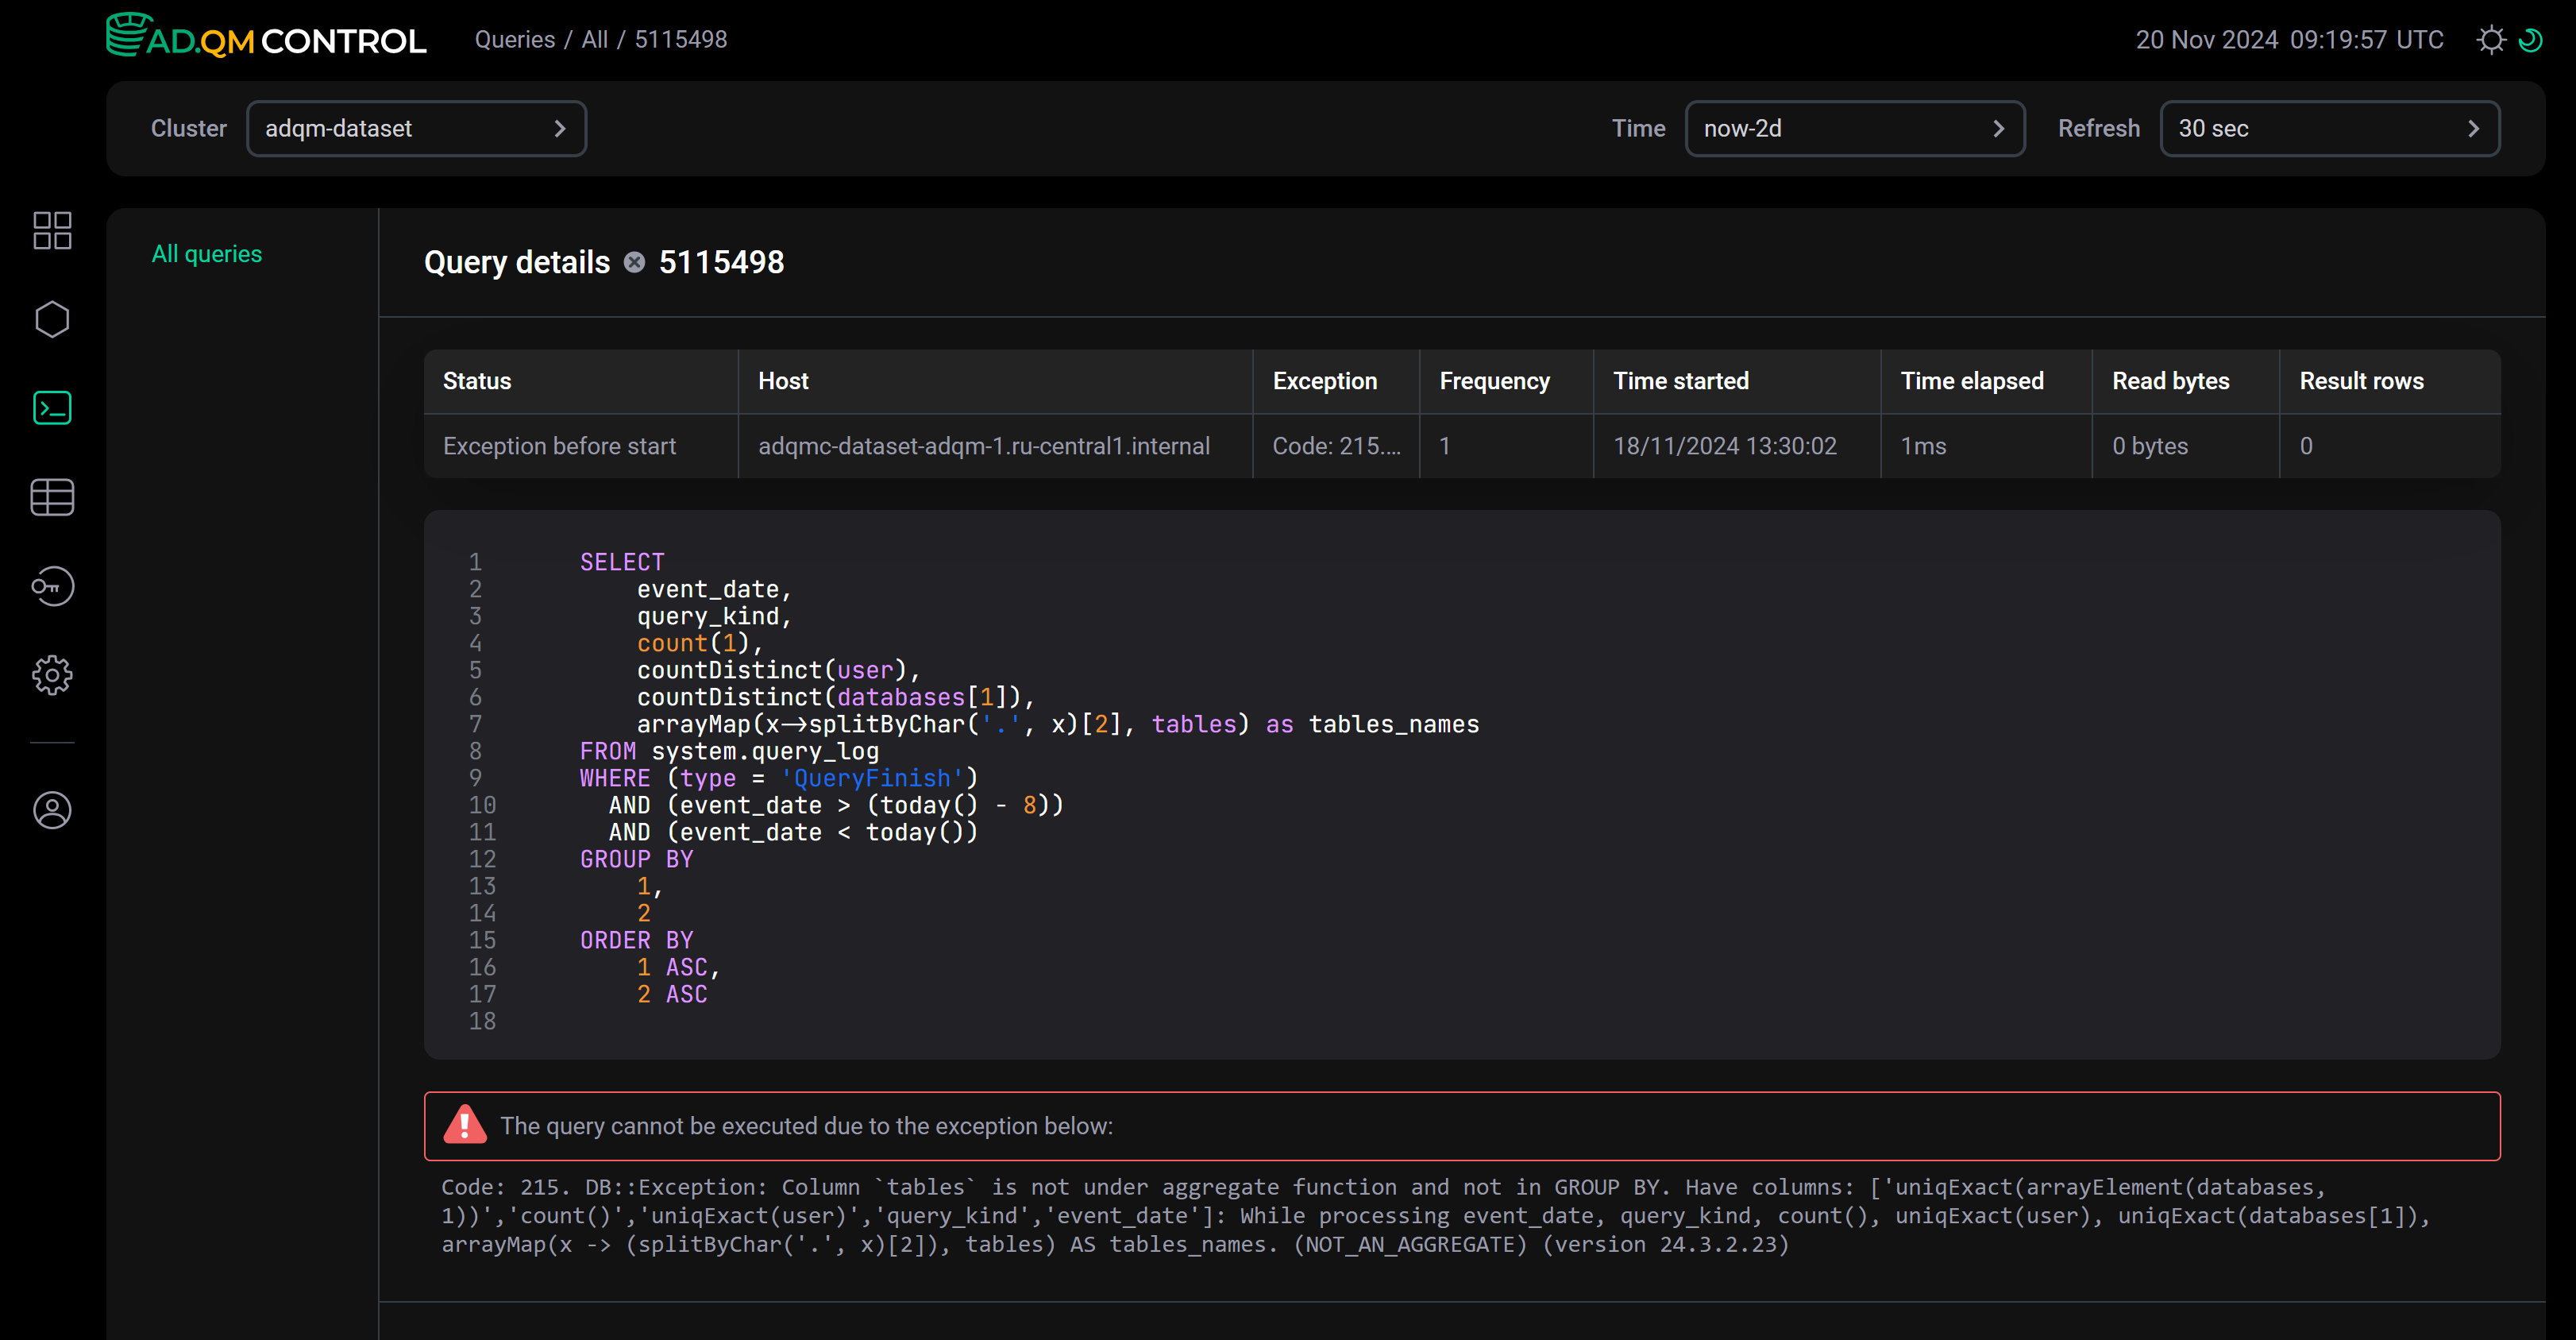
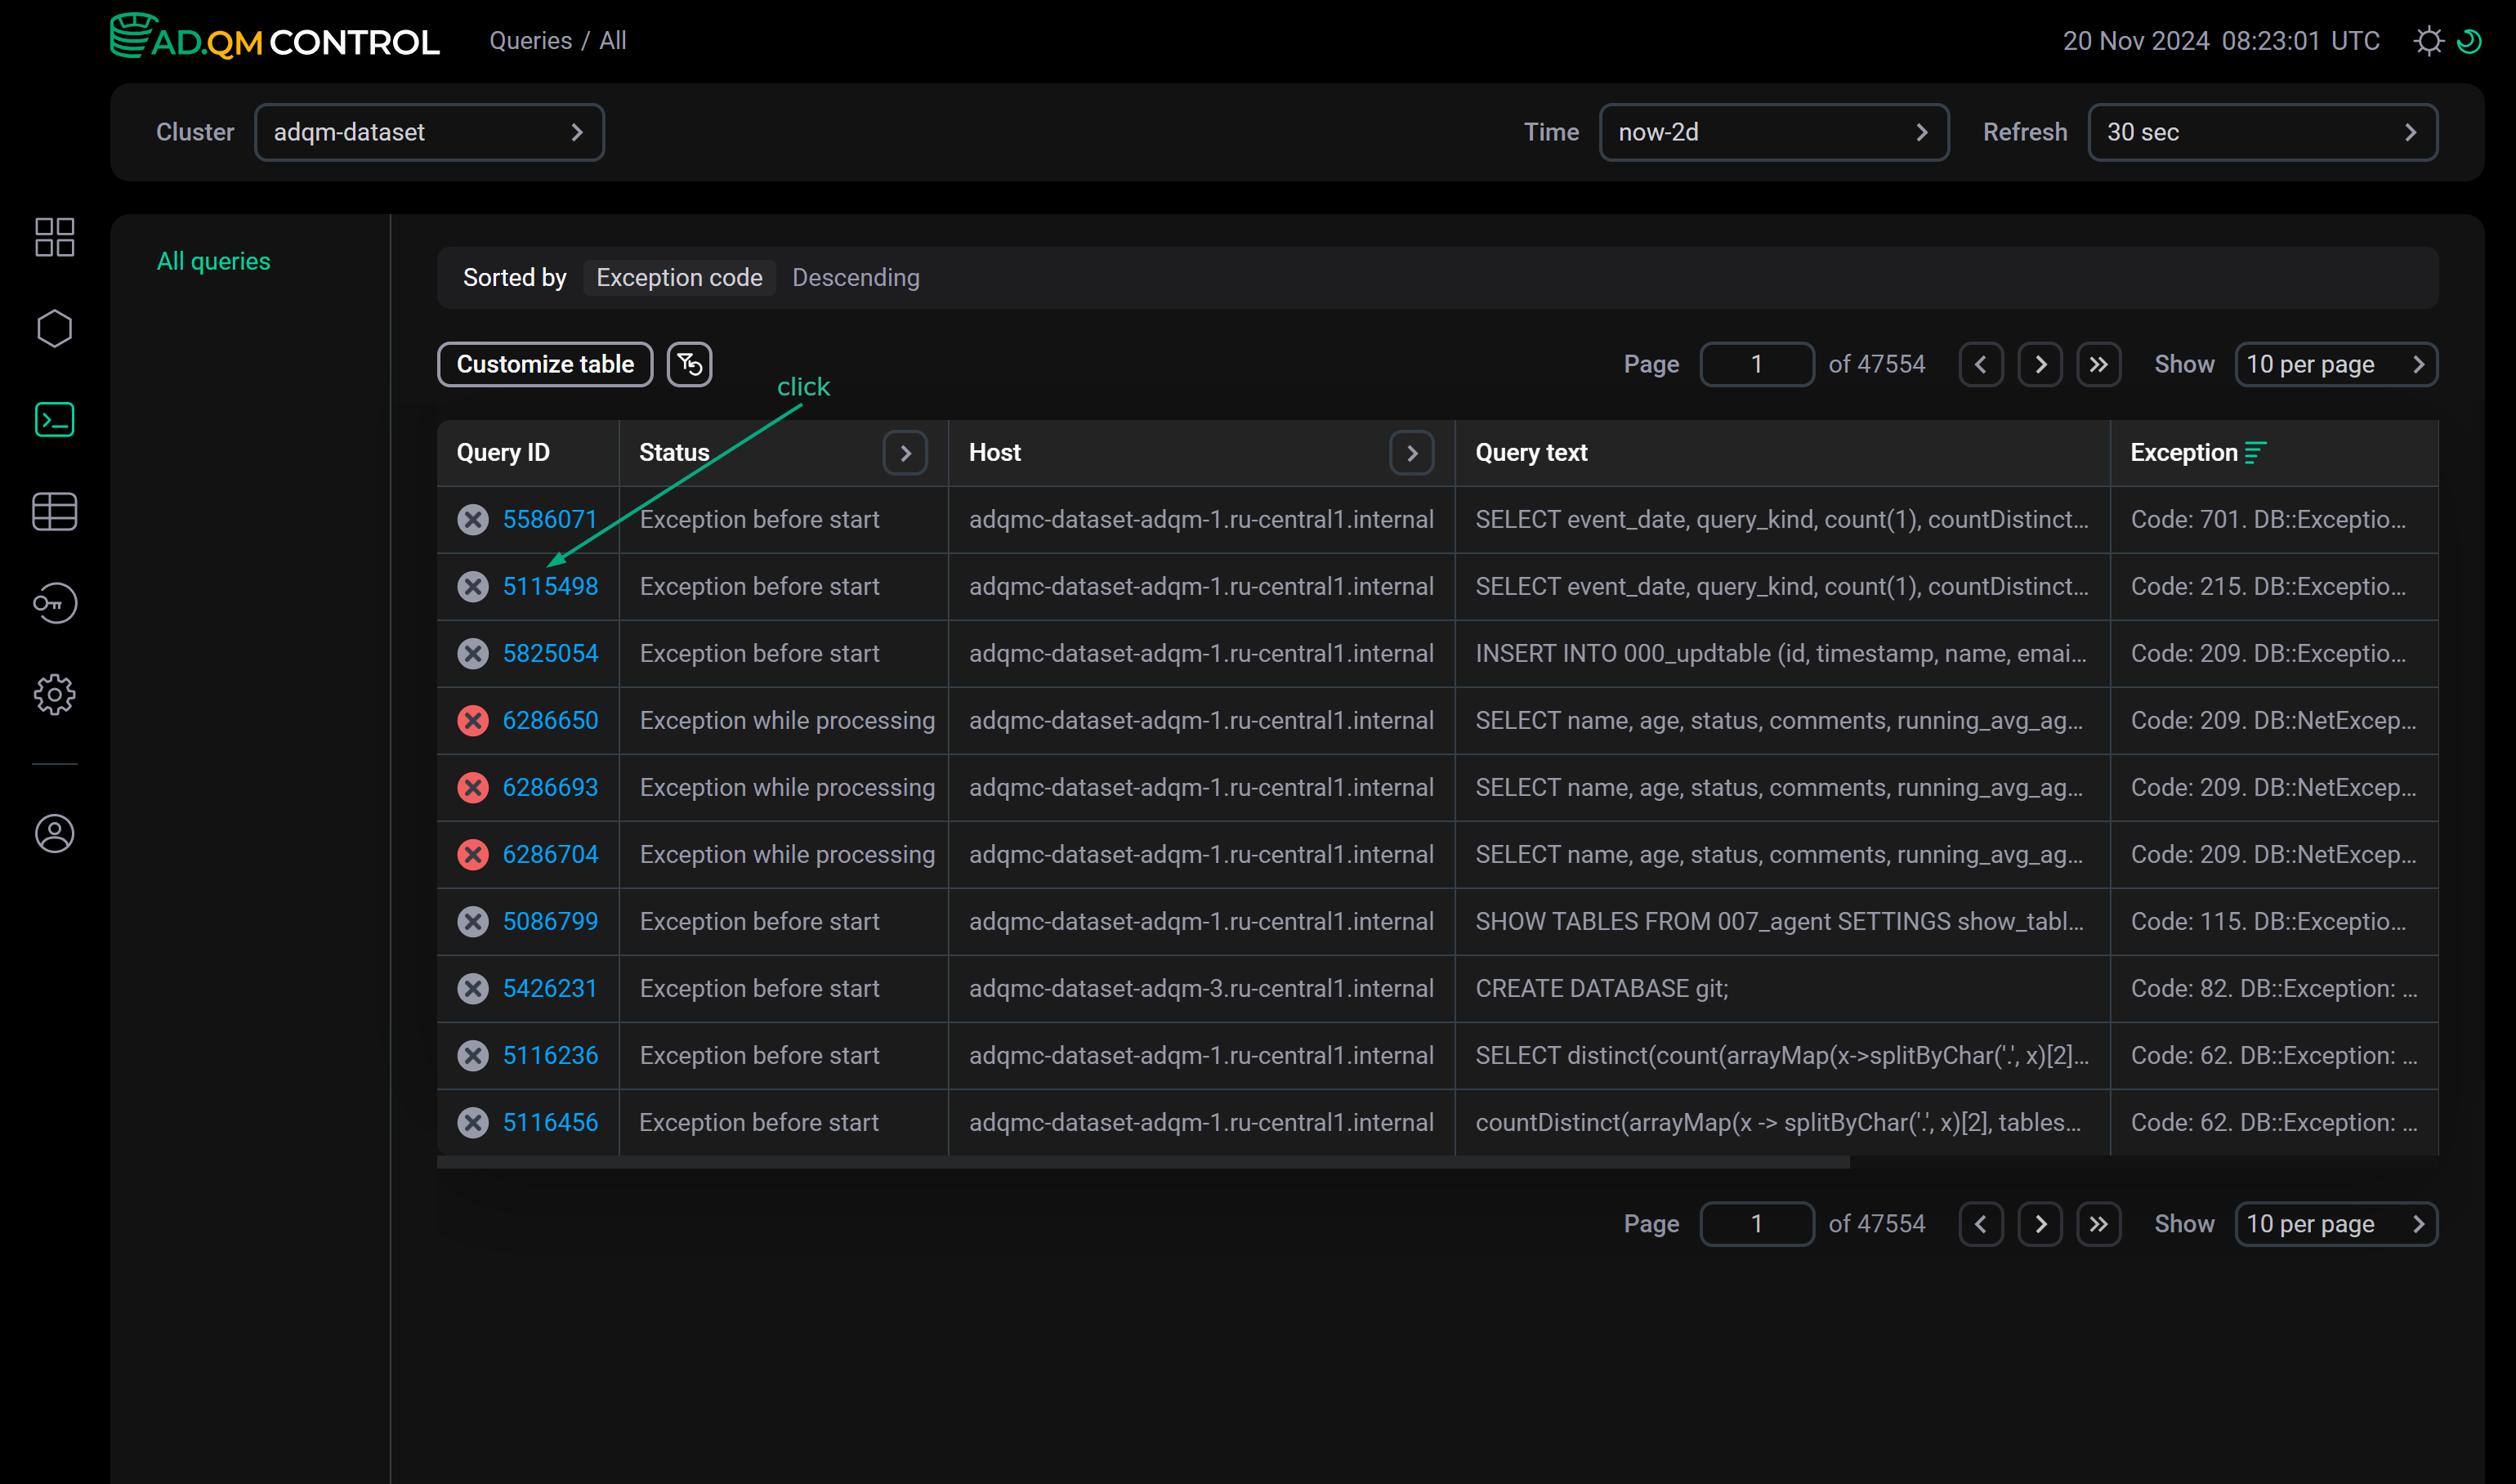
Query details
To view detailed information on a query, click its identifier in the Query ID field of the Queries table.
The Query details page that opens contains the full text of the selected query, as well as the description of an error if it has occurred during the query processing. The page also displays query metrics in the columns selected on the Queries page via Customize table.