Arenadata DB table changes tracking
- Overview
- User scenarios
- What we offer at the idea level
- Basis for the solution
- How does getting a changes track work
- How events are handled in changes track
- Transactional semantics of the tracking_get_track function
- Implementation details based on bloom filter
- Practical part: implementation of basic table monitoring


Overview
The history related to this task started for us in May 2024. One of the major Greenplum/Arenadata DB users requested us to implement the ability to track changes in the size of table data files. This functionality would become a source of events for the user cluster monitoring system. The task seemed fascinating and promising to us. However, as often happens, the user needed a solution yesterday.
On the one hand, we realized the complexity of this task in a fully functional implementation for all users of our product (and as a result, adequately estimated the expected workload). On the other hand, we considered it wrong to tailor the solution to a specific user, but at the same time deliver this implementation as a part of the overall solution. As a result, the development team continued working at its own pace and in accordance with its understanding of the implementation.
In this article:
-
We will introduce our new feature for tracking the size of table data files (I call it a changes track), which has become a part of the
arenadata_toolkitextension. It is also shipped with the open source version of Arenadata DB (we’ll likely consider porting this feature in some form to Greengage DB in the future). -
We will explain the basic principles of the proposed solution.
-
We will tell you about the difficulties we had to face and dive into the implementation details.
-
At the end of the article we will give an example of the simplest monitoring system based on this tracking of changes.
If you want to skip the "theory" and just see an example of using this solution in practice — here is a link to the relevant section.
User scenarios
Let’s start by formulating one of the basic user scenarios.
Imagine that the user has a large cluster in terms of the number of tables that this cluster manages (at this stage, we will not complicate things by assuming that there can be many such clusters). As developers, in addition to a number of important requirements, we are primarily interested in the quantitative characteristics of the infrastructure where our solution will work and the expectations from our solution regarding the performance.
Assume that we have the following input conditions (of course, we are talking about approximate values).
| Table type | Total number of tables |
|---|---|
AO tables row oriented |
10 000 |
AO tables column oriented |
200 000 |
Heap tables |
1 000 000 |
Since it is necessary to provide a "safety margin", the solution must be able to work with millions of tables and, depending on the size of the tables, with many times larger number of physical files containing the data of these tables.
Now the general scenario itself, from which the expected time characteristics can be determined:
Calculating and displaying the sizes of such a number of tables in a database with such frequency is definitely not an easy task.
Calculate the size of tables
At the very beginning, it is necessary to clarify what it means to calculate the full table size in PostgreSQL and Greenplum in particular.


If we consider heap tables schematically, then segment data files will be associated with the table (the heap table → heap segments relationship). The larger the table, the more files are associated with the table — for Greenplum, the maximum size of a heap segment is 1 GB: RELSEG_SIZE (32768 bytes) * BLCKSZ (32768 bytes), if exceeded, a new segment file is created.
Also, there are visibility and free space map files (heap table → vm and heap table → fsm). If there are attributes stored in TOAST tables, then there are TOAST table data files (heap table → toast). TOAST tables, in turn, have associated btree indexes (heap table → toast → toast btree).
Both btree indexes and TOAST tables are heap tables, meaning they have segment files, visibility (only for TOAST) and free space maps. A table can also have user-defined indexes.
To calculate the full size of a table, DBMS needs to extract these relationships from the system catalog metadata, go through all the relationships, determine the file size (in case of AO tables for data files, this will be the "logical" size, more on that later), and sum them up to get the final table size.
For AO tables, the approach is even more complicated, since they also have service aux tables. These are heap tables, which means again indexes, visibility maps, etc.


What existing tools are at our disposal
First, there are the basic system functions pg_relation_size, pg_table_size, and pg_total_relation_size.
These functions allow you to calculate the table size taking into account the selected fork (main, fsm, vm, init), the table size without indexes, and the total size with indexes.


Second, the gp_toolkit system schema implements several views, which, among other things, rely on the above functions. Here are some of them: gp_size_of_table_disk, gp_size_of_table_and_indexes_disk, gp_size_of_index. The convenience of these views is that they display detail by storage type (the main branch, data in TOAST, aux data for AO tables) in conjunction with and without indexes. The arenadata_toolkit schema has views for defining data skew by tables and their analogs that are several times faster in performance.
The diskquota extension solves a slightly different problem of limiting disk space consumption for tables, but in theory it could be improved in some way for our purposes.
How costly all this can be
To test queries and evaluate execution time, I created a database with the following set of test tables.
| relkind | relstorage | Number of tables |
|---|---|---|
ordinary relation ('r') |
heap |
450 092 |
index ('i') |
heap |
250 166 |
internal append-optimized segment files and EOFs ('o') |
heap |
250 005 |
ordinary relation ('r') |
append optimized table |
250 005 |
append-only visibility map ('M') |
heap |
250 005 |
As a test load to obtain the execution time and a performance profile of these operations, I executed a number of queries (3 runs each) with the cleared and warmed up cache. The queries were executed on the laptop DELL Latitude 5410, Intel Core i7, 256 GB SSD, 32 GB RAM.
| Operation type | Operation time (cache is cleared) | Operation time (cache is warmed up) |
|---|---|---|
Calculating the sizes of ~1.5 million tables using the |
12 min. 21 sec. |
8 min. 37 sec. |
Creating the |
13 min. 45 sec. |
10 min. 48 sec. |
As can be seen from the table above, even the test time required to obtain the sizes of the test database tables does not allow solving the problem with the specified requirements. For production clusters, you need to take into account the number of segments, the actual load, a larger number of data files, etc.
However, there are other reasons why we were not satisfied with the basic tools.
The main reason is that for AO tables, system functions calculate the logical size — for each table, DBMS needs to open its table with metadata, from where you need to read a row with an offset. The GetAOTotalBytes and GetAOCSTotalBytes kernel functions are responsible for this. These functions get the logical size from the aux table associated with each AO table (the aux table’s OID can be found in the segrelid field).
In addition to the expensive read call from the table, this value does not reflect the actual size of the table in some cases. For example, a long write transaction to such a table ended in a rollback due to lack of space, and the logical size was not updated. This is correct from the perspective of the kernel’s work with AO tables, but it is clearly not suitable for solving the problem of tracking the real size of the table data files. A user sees the previous logical table size, but in fact the files have filled the entire disk!
Create an AO table, interrupt the recording of a large block of data (100 million rows), and try to calculate the table size using the pg_total_relation_size function after interrupting the recording and rolling back the transaction:
andrey=# CREATE TABLE aoro_rollbacked(c1 INT) WITH (appendoptimized=true, orientation=row);
CREATE TABLE

andrey=# INSERT INTO aoro_rollbacked SELECT generate_series(1,1000);
INSERT 0 1000

andrey=# SELECT pg_size_pretty(pg_total_relation_size('aoro_rollbacked'::regclass));

 pg_size_pretty
----------------
 138 kB
(1 row)

andrey=# INSERT INTO aoro_rollbacked SELECT generate_series(1,100000000); (1)
^CCancel request sent
ERROR:  canceling statement due to user request

andrey=# SELECT pg_size_pretty(pg_total_relation_size('aoro_rollbacked'::regclass));

 pg_size_pretty
----------------
 138 kB  (2)
(1 row)
As you can see, after the transaction rollback (the line with marker 1), the logical size did not change (marker 2), although in fact the size of the first segment file (the zero file is reserved for AO tables) took up 220 MB on one of the segments at the time of the transaction rollback:
$ PGOPTIONS='-c gp_session_role=utility' psql -p 6002 -c 'SELECT pg_relation_filepath('\''aoro_rollbacked'\''::regclass);' -At | xargs -I % ls -lh '%.1'

-rw------- 1 andrey andrey 220M янв 25 12:13 base/5963210/2422978.1
Now, regarding the details that affect the final performance.
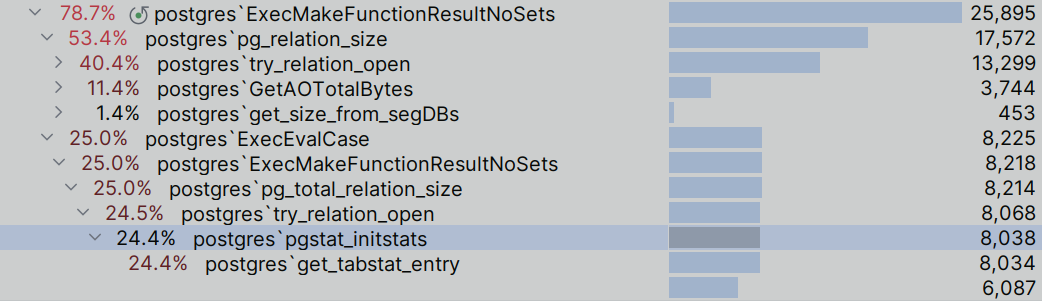
If you look at the profiling results of building the gp_size_of_table_and_indexes_disk view (the image above), you can see that a rather significant contribution to the total time is made by the table opening function (try_relation_open) and the above-mentioned function for obtaining the logical size of AO tables (GetAOTotalBytes). The costs of obtaining the physical file sizes themselves by the stat function are lost against the general background.
Since each view creation results in retrieving data from all tables, most of which can be assumed to remain unchanged, the overhead can fairly be considered unacceptable for users working with large amounts of data, the profile of which is characterized by a significant load on the disk subsystem.
The diskquota extension
The diskquota extension deployed on a large cluster can create many problems for its users. In short, the main elements of the architecture:
-
The master server has process (
BackgroundWorker), which collects data on table sizes from segments. -
Table sizes are stored in tables of the extension itself.
-
Hash tables are widely used in the implementation (example) to store table sizes.
-
Hash tables are located in the shared memory.
Thus, this extension has a potentially heavy state (both at runtime and in the DBMS itself in the form of tables).
Our team periodically implements some optimizations to this solution, but it still remains quite problematic for large clusters. Although there are currently no open and widely used alternatives in terms of limiting writes by storage space if the quota is exceeded.
What we offer at the idea level
Now, let’s talk about the proposed solution. It is based on the following principles:
-
Avoid maintaining heavy state in the database itself (for example, some updatable tables or something similar).
-
Build a changes track "on the fly".
-
Do not open tables unless absolutely necessary (for example, metadata in tables, catalogs, etc.).
-
Use compact data structures whenever possible.
As opposed to diskquota, we wanted to avoid storing heavy state in the database itself, the changes of which are tracked. As experience with diskquota shows, such a state can create a side load on the database and leads to performance problems for the main load.
We do not want to probe hash tables every time, which in theory they can grow to large sizes. Unfortunately, this cannot be completely avoided for all scenarios, more on this below. As a result, whenever possible, we need to use compact data structures that are limited in terms of memory consumption.
Basis for the solution
The Greenplum core provides the following basic tools that can be used to solve the problem of tracking table sizes:
-
The smgr.c and md.c low-level modules for working with physical files.
-
The actions we are interested in tracking are
create,extend,truncate, andunlink. (Further on I will call them events. The mapping of actions to events is given in the table below). -
Related hooks (created under diskquota).
-
Identification of tables and files (the table
OID, therelfilenodefile identifier).
The modules that are responsible for physical data storage (smgr and low-level md) have a mechanism for tracking some events in the system.
smgr is a common interface for storage managers. It provides a contract for operations like init, close, create, unlink, extend, read, write, truncate, etc. The md manager implements them. There is also a specific part for AO tables in aomd.
The main functions that interest us in the context of event tracking are: smgrcreate, smgrcreate_ao, smgrextend, smgrtruncate, and smgrdounlinkall. Some events are triggered from the implementation code of the AORO and AOCO tables.
| Function | Mapping event | Table type | Event description |
|---|---|---|---|
smgrcreate |
create |
heap |
Event of creating a heap table data file (taking into account the required |
smgrcreate_ao |
create |
AO |
Event of creating a new segment data file for the AO table |
smgrextend |
extend |
heap |
Event of extending a heap table data file with a new block (for heap tables the block size is |
BufferedAppendWrite |
extend |
AO |
Event of expanding an AO table segment data file with a new block |
smgrtruncate |
truncate |
heap |
Event of truncating the segment data file of a heap table to the required number of blocks ( |
TruncateAOSegmentFile |
truncate |
AO |
Event of truncating an AO table segment file, starting from some offset and up to the end of file |
smgrdounlinkall |
unlink |
heap/AO |
Deleting files associated with a table (unlink) |
All these functions contain callback calls to user hook functions, they are executed after calling system implementations:
typedef void (*file_create_hook_type) (RelFileNodeBackend rnode);
typedef void (*file_extend_hook_type) (RelFileNodeBackend rnode);
typedef void (*file_truncate_hook_type) (RelFileNodeBackend rnode);
typedef void (*file_unlink_hook_type) (RelFileNodeBackend rnode);
Table files are identified by the relfilenode identifier.
typedef struct RelFileNode
{
    Oid     spcNode;        /* tablespace */
    Oid     dbNode;         /* database */
    Oid     relNode;        /* relation */
} RelFileNode;
For example, for heap tables, it is the same for all table data files, as rows are written and the table grows (new segment files are added) it appends an integer postfix to it.
The RelFileNodeBackend instance can be simply considered as an identifier of a file to which some changes have occurred. The type of changes depends on the hook type.
typedef struct RelFileNodeBackend
{
    RelFileNode node;
    BackendId   backend;
} RelFileNodeBackend;
Relativity of events to the transaction life cycle
Now let’s consider the events in the context of their occurrence under different queries and transaction scenarios. Each of the events we are interested in affects either the consumption of disk space (extend, truncate, unlink), or, in case of the create event, the total number of tables in the database (some data files may initially be of zero size).
So, our main task is to track the create, extend, truncate, and unlink events with minimal impact on the DBMS performance. At the same time, it is important to spend a minimum of resources on this, which are more reasonable to devote to the main load.
If the extend and truncate events are quite simple and can be processed as they occur, then processing the events of creating and deleting table files presents certain difficulties. These difficulties are related to transactionality and, more precisely, to multi-statement transactionality.
As examples, consider the following queries:
BEGIN; CREATE TABLE t(...); INSERT INTO t ...; COMMIT;
BEGIN; CREATE TABLE t(...); INSERT INTO t ...; ROLLBACK;
BEGIN; CREATE TABLE t(...); DROP TABLE t; ROLLBACK;
CREATE TABLE t(...); BEGIN; ...; DROP TABLE t; ...; COMMIT;
CREATE TABLE t(...); BEGIN; ...; DROP TABLE t; ...; ROLLBACK;
For the sake of brevity, we will leave out the details concerning the table structure and the inserted data, as they are not of fundamental importance.
If we examine these scenarios in more detail in terms of kernel events, the picture is as follows.
BEGIN; CREATE TABLE t(...); INSERT INTO t ...; COMMIT;

The distinguishing feature of the first scenario shown in the image is that the events (in this case, create and extend at times t1, t2, t3) occur in the context of a table whose OID is not yet visible in the pg_class system table to other transactions according to the isolation rules.
Thus, in the transaction retrieving track changes, it is not possible to "pull out" the table information from pg_class using standard means. However, we must track these events and report them in the context of changes to tables to the changes track, since in this case the transaction is committed (COMMIT at time t6).
In the image above, at time t5, there is a call to the smgrDoPendingDeletes function, which is responsible for deleting files based on the transaction outcome. Since there are no table deletions here, it has nothing to do.
A different situation occurs for transaction ROLLBACK events:
BEGIN; CREATE TABLE t(...); INSERT INTO t ...; ROLLBACK;
BEGIN; CREATE TABLE t(...); DROP TABLE t; ROLLBACK;

In the first case, the transaction that creates the table is rolled back (time t4). In the second case, there is an explicit DROP TABLE, but the unlink event still occurs when processing the transaction rollback (time t6). So in terms of the moment the unlink event occurs, they are equivalent. Table files are created and filled with data and should be deleted in smgrDoPendingDeletes. There is work to be done for this function (time t5), since the data files that the rows managed to get into (the extend events occurred) must be deleted at the end of the transaction.
A couple more identical cases in terms of unlink events — the delete event occurs only at the moment of committing the transaction:
CREATE TABLE t(...); BEGIN; DROP TABLE t; ...; COMMIT;
BEGIN; CREATE TABLE t(...); DROP TABLE t; ...; COMMIT;

It is important to note that the unlink event occurs not when DROP TABLE is called at time t1, but as a result of committing the transaction in smgrDoPendingDeletes at time t4.
If the table was created previously, calling DROP TABLE followed by rolling back the transaction will not generate any events:
CREATE TABLE t (...); BEGIN; ...; DROP TABLE t; ...; ROLLBACK;

How does getting a changes track work
To get the changes track, the user needs to make a SELECT query to the arenadata_toolkit.tables_track view. Internally, this results in a call to the tracking_get_track function on the master and segment servers.
The changes track is a set of records in the following form:
  relid  |          relname           | relfilenode | size  | state | segid | relnamespace | relkind | relstorage | parent_relid
---------+----------------------------+-------------+-------+-------+-------+--------------+---------+------------+--------------
 5971396 | pg_aovisimap_5971392       |     2422956 |     0 | a     |    -1 |         6104 | M       | h          |      5971392
 5971394 | pg_aoseg_5971392           |     2422955 | 32768 | a     |    -1 |         6104 | o       | h          |      5971392
 5971402 | pg_aoblkdir_5971392_index  |     2422960 | 32768 | a     |    -1 |         6104 | i       | h          |      5971400
 5971392 | t1                         |     2422954 |     0 | a     |    -1 |         2200 | r       | a          |
 5971400 | pg_aoblkdir_5971392        |     2422959 |     0 | a     |    -1 |         6104 | b       | h          |      5971392
 5971399 | t1_c1_idx                  |     2422958 | 32768 | a     |    -1 |         2200 | i       | h          |      5971392
 5971398 | pg_aovisimap_5971392_index |     2422957 | 32768 | a     |    -1 |         6104 | i       | h          |      5971396
 5971396 | pg_aovisimap_5971392       |     2422949 |     0 | a     |     0 |         6104 | M       | h          |      5971392
 5971394 | pg_aoseg_5971392           |     2422948 | 32768 | a     |     0 |         6104 | o       | h          |      5971392
 5971402 | pg_aoblkdir_5971392_index  |     2422953 | 65536 | a     |     0 |         6104 | i       | h          |      5971400
 5971392 | t1                         |     2422947 |    32 | a     |     0 |         2200 | r       | a          |
 5971400 | pg_aoblkdir_5971392        |     2422952 | 32768 | a     |     0 |         6104 | b       | h          |      5971392
 5971399 | t1_c1_idx                  |     2422951 | 65536 | a     |     0 |         2200 | i       | h          |      5971392
 5971398 | pg_aovisimap_5971392_index |     2422950 | 32768 | a     |     0 |         6104 | i       | h          |      5971396
(14 rows)
Each record contains information about the table for which files change track events occurred. The time interval for tracking events is calculated from the moment of the previous request for the changes track and until the moment of the current request for the track of changes using the tracking_get_track function.
The relfilenode value identifies the file that was modified. For example, for heap tables, changes to different segment files will still be displayed with the original identifier from pg_class.relfilenode. The actual physical size of the table data files at the time of receiving the track is displayed in the size field. All information is provided for each segment (the segid field), according to the set of tracked events and filtering parameters (the relnamespace schema, the relkind table type, the relstorage storage type). A file is uniquely matched to a table (the relid and relname fields).
This set of fields allows you to build quite interesting analytics, we will see this in the section on using the solution in practice.
| Track field | Description |
|---|---|
relid |
Table |
relname |
Table name |
relfilenode |
The |
size |
The current (physical) size of the table data files |
state |
Possible values:
|
segid |
The identifier of the segment on which the table data file is located (the |
relnamespace |
Schema |
relkind |
Table type ( |
relstorage |
Table data storage type ( |
parent_relid |
|
One of the options for obtaining a changes track involves retrieving information on all required tables (according to the specified filters). This data is called the initial snapshot (the state field value for all records will be i). Such a snapshot is useful for obtaining initial information on table sizes, which will then be updated with a track of scoped, distinct changes. Obviously, getting the initial snapshot can take a significant amount of time for large clusters, but for subsequent changes it can be extremely compact. We expect that in most cases, a limited and small set of tables will be affected in the few minutes between change track queries.
A simplified algorithm for the tracking_get_track function is:
-
Open the
pg_catalog.pg_classtable for reading. -
For each entry in
pg_catalog.pg_class:2.1 Check
relnamespaceaccording to the set of tracked schemasarenadata_toolkit.tracking_schemas.2.2 Check
relkindaccording to the set of tracked table typesarenadata_toolkit.tracking_relkinds.2.3 Check
relstorageaccording to the set of tracked table data storage typesarenadata_toolkit.tracking_relstorages.2.4 If
pg_class.relfilenodeis included into the set of modified files (check by bloom filter, details are in the following sections), then we move on, otherwise we go to 2.2.5 Calculate the table size.
-
If an initial snapshot is requested, then:
3.1 Table deletion events are not reported.
-
Else:
4.1 Report deleted table data files with the
dflag.
How events are handled in changes track
Now let’s talk more about the implementation of step 2.4 in the above-described algorithm for the tracking_get_track function.
This step is key in terms of saving resources and speeding up the operation of tracking table sizes in general. The purpose of this step is to discard relfilinode identifiers that were not associated with monitored events and obtain sizes only for tables that have changed. Yes, the algorithm involves going through all pg_class rows, but this takes a small amount of time even for large clusters.
Another important factor is that when file change events occur, an extremely fast implementation of saving them is required for subsequent checking against this set in step 2.4. When inserting data and triggering the extend event, this operation will be extremely sensitive to the overall performance of the solution.
Taking into account the above principles of creating a track on the fly and using compact data structures, we decided to build our implementation based on storing information about a part of the events in the bloom filter.
This data structure implements a "probabilistic approach" to determine whether the element belongs to a certain set. However, given the compactness of the representation and the speed of operation, in general, it is suitable for solving the problem. Even if, in case of a false positive, we report that some file has changed and add information about this event to the changes track, this can be perceived as an update of the information. Since the bloom filter hash functions are implementation specific and cannot be customized by a user, the only parameter that determines the minimization of false positives is the size of the filter. As you know, a bloom filter is a bit array. To configure its size, we chose a value in bytes, which is determined by the arenadata_toolkit.tracking_bloom_size GUC setting. The main thing here is to choose the correct bloom filter size. After experimenting a bit, I chose 2 MB. (with values < 1 MB, files not affected by changes were regularly found in the changes track).
As an example, let’s consider handling the extend event (truncate is fundamentally no different).


The extend event handler checks that the given file is tracked (call is_file_node_trackable). These can be tables and materialized views: RELPERSISTENCE_PERMANENT, RELPERSISTENCE_TEMP, RELPERSISTENCE_UNLOGGED.
Next, the relfilenode identifier is saved (according to the results of bloom filter hash functions) in the bloom filter (bloom_set_set). This is a very fast operation. After that, by traversing pg_class and checking the identifiers using the bloom filter, it is possible to find out whether any file associated with this table has changed (taking into account the possibility of false positives, but this risk is accepted).
The peculiarity of the unlink event is that at the moment of calling the hook, there is no information about the table linked to the deleted files in pg_class. In fact, we only have the relfilenode identifier at our disposal. Obviously, traversing pg_class will not give data about this table, so we have to save the relfilenode identifier received in the hook until we receive the changes track in the linked list.
A detailed discussion of handling the create event is beyond the scope of this article. I will only say that at the moment, the implementation does not allow returning to the track changes of tables created within a transaction, which has not yet been committed. In the current implementation, we will report on this table only after the transaction is committed. We will prepare an additional article where we will describe the create event in more detail upon this feature release.
Transactional semantics of the tracking_get_track function
The changes track allows the following types of queries to be received:
-- We return information about changes in tables and "reset" the track.
-- Thus, changes included in this set of records will not be returned in the next query.
BEGIN; SELECT * FROM arenadata_toolkit.tables_track; COMMIT;

-- We return information about changes in tables, but the track is not reset.
-- In the next query, the changes will be a "super-position" of all the changes.
BEGIN; SELECT * FROM arenadata_toolkit.tables_track; ROLLBACK;
This can be useful for users who process records in some way and, say, transfer intermediate aggregate metrics to some other storage. If this processing fails, the transaction can be rolled back and the records (both new and old) can be processed in the next query.
To implement such a scheme, we used an interesting approach based on a version counter.
The idea is to calculate some counter value on the master segment in the stable function. Then this value is passed to the segments for comparison with their current value. If the transaction is committed, the version counter is incremented (both on the master and on the segments), otherwise it remains the same. The nuance is that since the track receiving transaction is not a writing transaction, and the execution of the track preparation function can be on the reading slice, the master will not know about the result of this operation on the segments.
Thus, there are two possible options for the segment:
-
The counter value received from the master segment is equal to the current value on the segment, which means that the previous transaction for obtaining a track is committed at the level of the entire cluster.
-
The value is different, which is equivalent to a transaction rollback.
How these situations affect track processing we will see in the next section.
Implementation details based on bloom filter
Each database is associated with its own set of bloom filters, which record change events that have occurred in the table data files. In the bloom filter, in essence, the necessary bits are set, which are calculated using the RelFileNodeBackend identifier by the filter’s hash functions. For some events, it is possible to utilize a simple recording of these events in a filter (extend, truncate). With create and unlink, as already mentioned, changes tracking has to use additional data structures and more complex processing.
To support transactional semantics, a pair of filters are required:
-
The first bloom filter instance is needed to store the
global context, which is required for individual calls of thetracking_get_trackfunction in different transactions. -
The second bloom filter instance is required for the
local contextof the currenttracking_get_trackcall.


The first instance of a bloom filter can be thought of as a single bit array, which is logically divided into two equal parts (bloom bits and bloom bits shadow). The first part stores the bits for the current bloom filter, which is handled by callback functions that set the bloom filter bits (hooks like file_create_hook_type). The second part is responsible for storing the filter state at the time of the previous call to tracking_get_track.
So, we have the compactly-stored state at the current moment and at the moment of the previous call. The previous state, as you can guess, is necessary for the transaction’s ROLLBACK.
For each tracking_get_track call, a local context with its initially empty filter is allocated, the current filter from the global context (the left part of the array) is copied to the local context. The tracking_get_track function continues to work with its state. Copying the bloom filter, of course, occurs under lock, but will be fast. At the same time, the global context will continue to track current events, without affecting the copy that the tracking_get_track transaction will continue to work with.
If the transaction is rolled back, the next query must join the filters bitwise, returning both the previous changes and the current ones. If the transaction is committed, only the latest data is returned.
Practical part: implementation of basic table monitoring
In the final part of the article, I will show how the track can be used to build the simple monitoring system and basic analytics on tables.
Initial metric source configuration
Let’s start by installing the extension, configuring filtering parameters, enabling changes tracking for the selected database, and checking that the changes are tracked:
$ gpconfig -c shared_preload_libraries -v 'arenadata_toolkit' (1)
20250122:16:22:12:164571 gpconfig:ldap:andrey-[INFO]:-completed successfully with parameters '-c shared_preload_libraries -v arenadata_toolkit'

$ gpstop -ar

$ psql
psql (9.4.26)
Type "help" for help.

andrey=# CREATE EXTENSION arenadata_toolkit;
andrey=# \dx
                                          List of installed extensions
       Name        | Version |   Schema   |                             Description
-------------------+---------+------------+---------------------------------------------------------------------
 arenadata_toolkit | 1.7     | public     | extension is used for manipulation of objects created by adb-bundle
 plpgsql           | 1.0     | pg_catalog | PL/pgSQL procedural language
(2 rows)

andrey=# SELECT arenadata_toolkit.tracking_set_relkinds('r,i,t');  (2)
andrey=# SELECT arenadata_toolkit.tracking_set_relstorages('h,a'); (3)
andrey=# SHOW arenadata_toolkit.tracking_schemas;
                    arenadata_toolkit.tracking_schemas
--------------------------------------------------------------------------
 public,arenadata_toolkit,pg_catalog,pg_toast,pg_aoseg,information_schema  (4)

andrey=# SELECT arenadata_toolkit.tracking_unregister_schema('information_schema'); (5)
andrey=# SELECT arenadata_toolkit.tracking_unregister_schema('pg_aoseg');           (6)
andrey=# SHOW arenadata_toolkit.tracking_schemas;
     arenadata_toolkit.tracking_schemas
--------------------------------------------
 public,arenadata_toolkit,pg_toast,pg_catalog

andrey=# SELECT arenadata_toolkit.tracking_register_db();                 (7)
andrey=# SELECT arenadata_toolkit.tracking_trigger_initial_snapshot();    (8)

andrey=# SELECT * from arenadata_toolkit.tables_track;    (9)
 relid |                            relname                             | relfilenode |  size  | state | segid | relnamespace | relkind | relstorage | parent_relid
-------+----------------------------------------------------------------+-------------+--------+-------+-------+--------------+---------+------------+--------------
  2840 | pg_toast_2619                                                  |       12542 |      0 | i     |    -1 |           99 | t       | h          |         2619
  2836 | pg_toast_1255                                                  |           0 |      0 | i     |    -1 |           99 | t       | h          |         1255
  2830 | pg_toast_2604                                                  |       12564 |      0 | i     |    -1 |           99 | t       | h          |         2604
  2832 | pg_toast_2606                                                  |       12571 |      0 | i     |    -1 |           99 | t       | h          |         2606
  2838 | pg_toast_2618                                                  |       12600 | 393216 | i     |    -1 |           99 | t       | h          |         2618
  2336 | pg_toast_2620                                                  |       12607 |      0 | i     |    -1 |           99 | t       | h          |         2620
  2834 | pg_toast_2609                                                  |       12616 |      0 | i     |    -1 |           99 | t       | h          |         2609
  2966 | pg_toast_2964                                                  |           0 |      0 | i     |    -1 |           99 | t       | h          |         2964
  2846 | pg_toast_2396                                                  |           0 |      0 | i     |    -1 |           99 | t       | h          |         2396
  5510 | pg_toast_3079                                                  |       12667 |      0 | i     |    -1 |           99 | t       | h          |         3079
  3598 | pg_toast_3596                                                  |       12682 |      0 | i     |    -1 |           99 | t       | h          |         3596
  6092 | pg_toast_5036                                                  |           0 |      0 | i     |    -1 |           99 | t       | h          |         5036
  6233 | pg_toast_6231                                                  |       12732 |      0 | i     |    -1 |           99 | t       | h          |         6231
  9905 | pg_toast_9903                                                  |       12745 |      0 | i     |    -1 |           99 | t       | h          |         9903
  6222 | pg_toast_6220                                                  |       12752 |      0 | i     |    -1 |           99 | t       | h          |         6220
 12202 | pg_toast_12200                                                 |       12765 |      0 | i     |    -1 |           99 | t       | h          |        12200
 12207 | pg_toast_12205                                                 |       12772 |      0 | i     |    -1 |           99 | t       | h          |        12205
 12212 | pg_toast_12210                                                 |       12779 |      0 | i     |    -1 |           99 | t       | h          |        12210
 12217 | pg_toast_12215                                                 |       12786 |      0 | i     |    -1 |           99 | t       | h          |        12215
 12222 | pg_toast_12220                                                 |       12793 |      0 | i     |    -1 |           99 | t       | h          |        12220
 12227 | pg_toast_12225                                                 |       12800 |      0 | i     |    -1 |           99 | t       | h          |        12225
 12232 | pg_toast_12230                                                 |       12807 |      0 | i     |    -1 |           99 | t       | h          |        12230
  2755 | pg_opfamily_oid_index                                          |       10033 |  65536 | i     |    -1 |           11 | i       | h          |         2753
  6058 | pg_statlastshop_classid_objid_staactionname_index              |           0 |      0 | i     |    -1 |           11 | i       | h          |         6056
  6056 | pg_stat_last_shoperation                                       |           0 |      0 | i     |    -1 |           11 | r       | h          |
  2692 | pg_rewrite_oid_index                                           |       10047 |  65536 | i     |    -1 |           11 | i       | h          |         2618
  2677 | pg_authid_oid_index                                            |           0 |      0 | i     |    -1 |           11 | i       | h          |         1260
  2611 | pg_inherits                                                    |       12573 |      0 | i     |    -1 |           11 | r       | h          |
 12214 | pg_toast_12210_index                                           |       10155 |  32768 | i     |    -1 |           99 | i       | h          |        12212
--More--
Let’s explain some steps:
| 1 | arenadata_toolkit.so should be loaded as shared preload library before setting changes tracking as active for the database. |
| 2 | arenadata_toolkit.tracking_relkinds GUC defines a set of table types for which events are tracked. By default, the following table types are tracked: r, i, t, m, o, b, M. This corresponds to the following set of types:
  RELKIND_RELATION		  'r'		/* ordinary table */
  RELKIND_INDEX			  'i'		/* secondary index */
  RELKIND_TOASTVALUE	  't'		/* for out-of-line values */
  RELKIND_MATVIEW		  'm'		/* materialized view */
  RELKIND_AOSEGMENTS	  'o'		/* AO segment files and eof's */
  RELKIND_AOBLOCKDIR	  'b'		/* AO block directory */
  RELKIND_AOVISIMAP		  'M'		/* AO visibility map */
As you can see from the line with marker |
| 3 | arenadata_toolkit.tracking_relstorages GUC defines a set of table storage types. By default, the following types of tables are tracked: h, a, c. This corresponds to the set:
  RELSTORAGE_HEAP	'h'
  RELSTORAGE_AOROWS	'a'
  RELSTORAGE_AOCOLS	'c'
From the line with the marker |
| 4 | Display a list of schemes that are included to the selection from the changes track by default. |
| 5 | Exclude information_schema from the list of schemas we are interested in. |
| 6 | Exclude pg_aoseg from the list of schemas we are interested in. |
| 7 | Register the current database as being tracked by the changes track. |
| 8 | To demonstrate the tracking_trigger_initial_snapshot function, we set the flag to receive the full track on the next query. |
| 9 | A track request from the tables_track view will give us a complete snapshot, as indicated by the i flag in each value of the state field. |
As a result, we got a complete snapshot, including the public, arenadata_toolkit, pg_toast, and pg_catalog schemas, but from which the columnar AO tables and all aux tables are excluded.
This is easy to check and reconfigure on the fly:
andrey=# CREATE TABLE aoro (c1 INT) WITH (appendoptimized=true, orientation=row);
CREATE TABLE

andrey=# CREATE TABLE aoco (c1 INT) WITH (appendoptimized=true, orientation=column);
CREATE TABLE

andrey=# BEGIN; SELECT * FROM arenadata_toolkit.tables_track WHERE relnamespace = 2200; ROLLBACK;
BEGIN
 relid | relname | relfilenode | size | state | segid | relnamespace | relkind | relstorage | parent_relid
-------+---------+-------------+------+-------+-------+--------------+---------+------------+--------------
 16542 | aoro    |       16438 |    0 | a     |    -1 |         2200 | r       | a          |
 16542 | aoro    |       16438 |    0 | a     |     1 |         2200 | r       | a          |
 16542 | aoro    |       16438 |    0 | a     |     2 |         2200 | r       | a          |
 16542 | aoro    |       16438 |    0 | a     |     0 |         2200 | r       | a          |
(4 rows)
)

ROLLBACK

andrey=# SELECT arenadata_toolkit.tracking_set_relstorages('h,a,c');    (1)
andrey=# SELECT arenadata_toolkit.tracking_set_relkinds('r,i,t,o,M');   (2)
andrey=# SELECT arenadata_toolkit.tracking_register_schema('pg_aoseg'); (3)

andrey=# BEGIN; SELECT * FROM arenadata_toolkit.tables_track WHERE relnamespace IN (2200, 6104); ROLLBACK;
BEGIN
 relid |         relname          | relfilenode | size  | state | segid | relnamespace | relkind | relstorage | parent_relid
-------+--------------------------+-------------+-------+-------+-------+--------------+---------+------------+--------------
 16546 | pg_aovisimap_16542       |       16440 |     0 | a     |    -1 |         6104 | M       | h          |        16542
 16553 | pg_aovisimap_16549       |       16444 |     0 | a     |    -1 |         6104 | M       | h          |        16549
 16551 | pg_aocsseg_16549         |       16443 |     0 | a     |    -1 |         6104 | o       | h          |        16549
 16544 | pg_aoseg_16542           |       16439 |     0 | a     |    -1 |         6104 | o       | h          |        16542
 16542 | aoro                     |       16438 |     0 | a     |    -1 |         2200 | r       | a          |
 16555 | pg_aovisimap_16549_index |       16445 | 32768 | a     |    -1 |         6104 | i       | h          |        16553
 16548 | pg_aovisimap_16542_index |       16441 | 32768 | a     |    -1 |         6104 | i       | h          |        16546
 16549 | aoco                     |       16442 |     0 | a     |    -1 |         2200 | r       | c          |
 16553 | pg_aovisimap_16549       |       16444 |     0 | a     |     0 |         6104 | M       | h          |        16549
 16553 | pg_aovisimap_16549       |       16444 |     0 | a     |     1 |         6104 | M       | h          |        16549
 16553 | pg_aovisimap_16549       |       16444 |     0 | a     |     2 |         6104 | M       | h          |        16549
 16548 | pg_aovisimap_16542_index |       16441 | 32768 | a     |     0 |         6104 | i       | h          |        16546
 16548 | pg_aovisimap_16542_index |       16441 | 32768 | a     |     1 |         6104 | i       | h          |        16546
 16548 | pg_aovisimap_16542_index |       16441 | 32768 | a     |     2 |         6104 | i       | h          |        16546
 16551 | pg_aocsseg_16549         |       16443 |     0 | a     |     0 |         6104 | o       | h          |        16549
 16551 | pg_aocsseg_16549         |       16443 |     0 | a     |     1 |         6104 | o       | h          |        16549
 16551 | pg_aocsseg_16549         |       16443 |     0 | a     |     2 |         6104 | o       | h          |        16549
 16549 | aoco                     |       16442 |     0 | a     |     0 |         2200 | r       | c          |
 16549 | aoco                     |       16442 |     0 | a     |     1 |         2200 | r       | c          |
 16549 | aoco                     |       16442 |     0 | a     |     2 |         2200 | r       | c          |
 16555 | pg_aovisimap_16549_index |       16445 | 32768 | a     |     1 |         6104 | i       | h          |        16553
 16555 | pg_aovisimap_16549_index |       16445 | 32768 | a     |     0 |         6104 | i       | h          |        16553
 16555 | pg_aovisimap_16549_index |       16445 | 32768 | a     |     2 |         6104 | i       | h          |        16553
 16546 | pg_aovisimap_16542       |       16440 |     0 | a     |     1 |         6104 | M       | h          |        16542
 16546 | pg_aovisimap_16542       |       16440 |     0 | a     |     0 |         6104 | M       | h          |        16542
 16546 | pg_aovisimap_16542       |       16440 |     0 | a     |     2 |         6104 | M       | h          |        16542
 16544 | pg_aoseg_16542           |       16439 |     0 | a     |     1 |         6104 | o       | h          |        16542
 16544 | pg_aoseg_16542           |       16439 |     0 | a     |     0 |         6104 | o       | h          |        16542
 16544 | pg_aoseg_16542           |       16439 |     0 | a     |     2 |         6104 | o       | h          |        16542
 16542 | aoro                     |       16438 |     0 | a     |     1 |         2200 | r       | a          |
 16542 | aoro                     |       16438 |     0 | a     |     0 |         2200 | r       | a          |
 16542 | aoro                     |       16438 |     0 | a     |     2 |         2200 | r       | a          |
(32 rows)

ROLLBACK
Note that in the lines with markers 1-3, we returned the AO tables, visibility maps (RELKIND_AOVISIMAP), the main metadata table of AO tables (RELKIND_AOSEGMENTS), and the pg_aoseg service schema.
Moreover, the information on these tables was included in the second selection, since we did ROLLBACK!
Implement the simplest metrics monitoring
Let’s build a simple, but nevertheless useful, basic monitoring based on our solution.


The architecture of interaction between the components will be as follows:
-
Arenadata DB cluster with installed
arenadata_toolkitsupporting the changes track. -
A separate PostgreSQL 16 instance that will request the track every 30 seconds, store the raw track data, and calculate aggregates.
-
A Grafana instance for storing and displaying metrics.


To obtain metrics from the Arenadata DB cluster, we use the postgres_fdw extension, which we install on the PostgreSQL cluster, and configure the server, user mapping, and external tables:
postgres=# CREATE EXTENSION IF NOT EXISTS postgres_fdw;

CREATE SERVER adb6_server
FOREIGN DATA WRAPPER postgres_fdw
OPTIONS (host 'localhost', port '6000', dbname 'andrey');

CREATE USER MAPPING FOR CURRENT_USER
SERVER adb6_server
OPTIONS (user 'adb_track_files', password 'qwerty');

CREATE FOREIGN TABLE public.adb_tables_track (
  relid oid,
  relname name,
  relfilenode oid,
  size bigint,
  state "char",
  segid int,
  relnamespace oid,
  relkind "char",
  relstorage "char",
  parent_relid oid
)
SERVER adb6_server
OPTIONS (schema_name 'arenadata_toolkit', table_name 'tables_track');

CREATE FOREIGN TABLE public.is_initial_snapshot_triggered (is_triggered int)
SERVER adb6_server
OPTIONS (schema_name 'arenadata_toolkit', table_name 'is_initial_snapshot_triggered');
On the Arenadata DB side, configure a user to receive a track from the PostgreSQL side:
$ psql -c 'CREATE USER adb_track_files WITH ENCRYPTED PASSWORD '\''qwerty'\'';'
$ echo 'host andrey adb_track_files 127.0.0.1/32 md5' >> $MASTER_DATA_DIRECTORY/pg_hba.conf
$ gpstop -u
On the PostgreSQL side, check the possibility of obtaining a track:
postgres=# BEGIN; SELECT * FROM public.adb_tables_track; ROLLBACK;
 relid |                   relname                   | relfilenode | size  | state | segid | relnamespace | relkind | relstorage | parent_relid
-------+---------------------------------------------+-------------+-------+-------+-------+--------------+---------+------------+--------------
  5002 | gp_distribution_policy                      |       12704 | 32768 | a     |    -1 |           11 | r       | h          |
  6231 | pg_attribute_encoding                       |       12727 | 32768 | a     |    -1 |           11 | r       | h          |
  6105 | pg_appendonly                               |       12717 | 32768 | a     |    -1 |           11 | r       | h          |
  6067 | gp_fastsequence_objid_objmod_index          |       10127 | 65536 | a     |    -1 |           11 | i       | h          |         5043
 16555 | pg_aovisimap_16549_index                    |       16445 | 32768 | a     |    -1 |         6104 | i       | h          |        16553
 16546 | pg_aovisimap_16542                          |       16440 |     0 | a     |    -1 |         6104 | M       | h          |        16542
  5007 | pg_appendonly_relid_index                   |       10126 | 65536 | a     |    -1 |           11 | i       | h          |         6105
 16553 | pg_aovisimap_16549                          |       16444 |     0 | a     |    -1 |         6104 | M       | h          |        16549
 16548 | pg_aovisimap_16542_index                    |       16441 | 32768 | a     |    -1 |         6104 | i       | h          |        16546
 16551 | pg_aocsseg_16549                            |       16443 |     0 | a     |    -1 |         6104 | o       | h          |        16549
 16544 | pg_aoseg_16542                              |       16439 |     0 | a     |    -1 |         6104 | o       | h          |        16542
 16542 | aoro                                        |       16438 |     0 | a     |    -1 |         2200 | r       | a          |
  6236 | pg_attribute_encoding_attrelid_index        |       10137 | 65536 | a     |    -1 |           11 | i       | h          |         6231
 16549 | aoco                                        |       16442 |     0 | a     |    -1 |         2200 | r       | c          |
  6103 | gp_policy_localoid_index                    |       10121 | 65536 | a     |    -1 |           11 | i       | h          |         5002
  5043 | gp_fastsequence                             |       12719 | 32768 | a     |    -1 |           11 | r       | h          |
  6237 | pg_attribute_encoding_attrelid_attnum_index |       10138 | 65536 | a     |    -1 |           11 | i       | h          |         6231
  5002 | gp_distribution_policy                      |       12704 | 32768 | a     |     1 |           11 | r       | h          |
  6231 | pg_attribute_encoding                       |       12727 | 32768 | a     |     1 |           11 | r       | h          |
  6105 | pg_appendonly                               |       12717 | 32768 | a     |     1 |           11 | r       | h          |
  6067 | gp_fastsequence_objid_objmod_index          |       10127 | 65536 | a     |     1 |           11 | i       | h          |         5043
 16555 | pg_aovisimap_16549_index                    |       16445 | 32768 | a     |     1 |         6104 | i       | h          |        16553
 16546 | pg_aovisimap_16542                          |       16440 |     0 | a     |     1 |         6104 | M       | h          |        16542
  5007 | pg_appendonly_relid_index                   |       10126 | 65536 | a     |     1 |           11 | i       | h          |         6105
 16553 | pg_aovisimap_16549                          |       16444 |     0 | a     |     1 |         6104 | M       | h          |        16549
 16548 | pg_aovisimap_16542_index                    |       16441 | 32768 | a     |     1 |         6104 | i       | h          |        16546
 16551 | pg_aocsseg_16549                            |       16443 |     0 | a     |     1 |         6104 | o       | h          |        16549
 16544 | pg_aoseg_16542                              |       16439 |     0 | a     |     1 |         6104 | o       | h          |        16542
 16542 | aoro                                        |       16438 |     0 | a     |     1 |         2200 | r       | a          |
  6236 | pg_attribute_encoding_attrelid_index        |       10137 | 65536 | a     |     1 |           11 | i       | h          |         6231
 16549 | aoco                                        |       16442 |     0 | a     |     1 |         2200 | r       | c          |
  6103 | gp_policy_localoid_index                    |       10121 | 65536 | a     |     1 |           11 | i       | h          |         5002
  5043 | gp_fastsequence                             |       12719 | 32768 | a     |     1 |           11 | r       | h          |
  6237 | pg_attribute_encoding_attrelid_attnum_index |       10138 | 65536 | a     |     1 |           11 | i       | h          |         6231
  5002 | gp_distribution_policy                      |       12704 | 32768 | a     |     2 |           11 | r       | h          |
  6231 | pg_attribute_encoding                       |       12727 | 32768 | a     |     2 |           11 | r       | h          |
  6105 | pg_appendonly                               |       12717 | 32768 | a     |     2 |           11 | r       | h          |
  6067 | gp_fastsequence_objid_objmod_index          |       10127 | 65536 | a     |     2 |           11 | i       | h          |         5043
 16555 | pg_aovisimap_16549_index                    |       16445 | 32768 | a     |     2 |         6104 | i       | h          |        16553
 16546 | pg_aovisimap_16542                          |       16440 |     0 | a     |     2 |         6104 | M       | h          |        16542
  5007 | pg_appendonly_relid_index                   |       10126 | 65536 | a     |     2 |           11 | i       | h          |         6105
:
Create service tables to save "raw" track data:
CREATE TABLE public.adb_tables_track_snapshot (relid oid,
            relname name,
            relfilenode oid,
            size bigint,
            state "char",
            segid int,
            relnamespace oid,
            relkind name,
            relstorage name,
            parent_relid oid,
            ts timestamp);

CREATE UNIQUE INDEX relfilenode_segid_relid_idx ON public.adb_tables_track_snapshot (relfilenode, segid);

CREATE OR REPLACE VIEW public.table_sizes AS
WITH RECURSIVE t AS (
  SELECT
    relid as toprelid,
    relid,
    relname,
    relkind,
    relstorage,
    relnamespace,
    size,
    segid
  FROM public.adb_tables_track_snapshot
  WHERE
  parent_relid IS NULL
  AND
  state <> 'd'
  UNION
  SELECT
    c.toprelid,
    p.relid,
    c.relname,
    c.relkind,
    c.relstorage,
    c.relnamespace,
    p.size,
    p.segid
  FROM public.adb_tables_track_snapshot p
  INNER JOIN t c ON c.relid = p.parent_relid
  WHERE
  state <> 'd'
)
SELECT toprelid, relname, relkind, relstorage, relnamespace, SUM(size) AS total_size
FROM t
GROUP BY toprelid, relname, relkind, relstorage, relnamespace;
To collect and process track data, use this function:
CREATE OR REPLACE FUNCTION public.collect_track()
RETURNS void
LANGUAGE plpgsql
AS $function$
BEGIN

    DROP TABLE IF EXISTS adb_tables_track_snapshot_temp;

    CREATE TEMP TABLE adb_tables_track_snapshot_temp AS
    SELECT
        relid,
        relname,
        relfilenode,
        size,
        state,
        segid,
        relnamespace,
        case
            when relkind='r' then 'ordinary table'
            when relkind='i' then 'secondary index'
            when relkind='s' then 'sequence object'
            when relkind='t' then 'toast'
            when relkind='v' then 'view'
            when relkind='m' then 'materialized view'
            when relkind='c' then 'composite type'
            when relkind='f' then 'foreign table'
            when relkind='p' then 'partitioned table'
            when relkind='I' then 'partitioned index'
            when relkind='o' then 'AO segment files'
            when relkind='b' then 'AO block directory'
            when relkind='M' then 'AO visibility map'
            else 'unknown relkind'
        end as relkind,
        case
            when relstorage='h' then 'heap storage'
            when relstorage='a' then 'append only storage'
            when relstorage='c' then 'append only column storage'
            when relstorage='v' then 'virtual storage'
            when relstorage='x' then 'stored externally'
            when relstorage='f' then 'stored in another server'
            else 'unknown relstorage'
        end as relstorage,
        parent_relid,
        current_timestamp AS ts
    FROM adb_tables_track;

	IF EXISTS (SELECT 1 FROM is_initial_snapshot_triggered WHERE is_triggered = 1) (3)
	THEN

		TRUNCATE TABLE adb_tables_track_snapshot;

		INSERT INTO adb_tables_track_snapshot
		SELECT *
		FROM adb_tables_track_snapshot_temp
		WHERE relfilenode <> 0; (1)

	ELSE

        INSERT INTO adb_tables_track_snapshot
		SELECT
			relid,
			relname,
			relfilenode,
			size,
			state,
			segid,
			relnamespace,
			relkind,
			relstorage,
			parent_relid,
			current_timestamp AS ts
		FROM adb_tables_track_snapshot_temp
		WHERE relfilenode <> 0
		ON CONFLICT (relfilenode, segid) (2)
		DO UPDATE SET
		  size = EXCLUDED.size,
		  ts = EXCLUDED.ts,
		  state = EXCLUDED.state;

	END IF;

END$function$;
There are some important points to note:
| 1 | With the WHERE relfilenode <> 0 condition, we exclude shared system tables (in PostgreSQL terms), for which the relfilenode field is always equal to 0. For example, these are the pg_type, pg_attribute, pg_database, pg_tablespace tables and a number of others. There are no restrictions on tracking changes for them, but this processing would be rather complicated for this example case. The relfilenode identifier for such tables will be 0. These rows would have to be identified by the segid and relid pair, and not by relfilenode, segid (the line with the 2 marker). |
| 2 | To update information on tables, the INSERT INTO … ON CONFLICT (…) DO UPDATE SET statement is used. It allows updating data in the snapshot based on the changes received in the track. |
| 3 | If an initial snapshot was requested on the source side, then the full initial snapshot is saved. |
Before getting the initial snapshot, call the arenadata_toolkit.tracking_trigger_initial_snapshot() function on the Arenadata DB side:
andrey=# SELECT arenadata_toolkit.tracking_trigger_initial_snapshot();
 tracking_trigger_initial_snapshot
-----------------------------------
 t
(1 row)
Check that the changes track is received and updated:
postgres=# SELECT public.collect_track();
NOTICE:  table "adb_tables_track_snapshot_temp" does not exist, skipping
 collect_track
---------------

(1 row)

postgres=# SELECT * FROM table_sizes WHERE relnamespace = 2200;

 toprelid |         relname         |    relkind     |         relstorage         | relnamespace | total_size
----------+-------------------------+----------------+----------------------------+--------------+------------
    16542 | aoro                    | ordinary table | append only storage        |         2200 |     131072
    16549 | aoco                    | ordinary table | append only column storage |         2200 |     131072
(2 rows)
On the Arenadata DB side, perform insertion into the aoro table and delete the aoco table:
andrey=# INSERT INTO aoro SELECT generate_series(1,100000000);
INSERT 0 100000000

andrey=# DROP TABLE aoco;

andrey=# BEGIN; SELECT * from arenadata_toolkit.tables_track; ROLLBACK;
BEGIN
 relid |    relname     | relfilenode |   size    | state | segid | relnamespace | relkind | relstorage | parent_relid
-------+----------------+-------------+-----------+-------+-------+--------------+---------+------------+--------------
       |                |       16442 |         0 | d     |    -1 |              |         |            |
       |                |       16443 |         0 | d     |    -1 |              |         |            |
       |                |       16444 |         0 | d     |    -1 |              |         |            |
       |                |       16445 |         0 | d     |    -1 |              |         |            |
 16544 | pg_aoseg_16542 |       16439 |     32768 | a     |    -1 |         6104 | o       | h          |        16542
       |                |       16442 |         0 | d     |     2 |              |         |            |
       |                |       16443 |         0 | d     |     2 |              |         |            |
       |                |       16444 |         0 | d     |     2 |              |         |            |
       |                |       16445 |         0 | d     |     2 |              |         |            |
 16544 | pg_aoseg_16542 |       16439 |     32768 | a     |     2 |         6104 | o       | h          |        16542
 16542 | aoro           |       16438 | 333872320 | a     |     2 |         2200 | r       | a          |
       |                |       16442 |         0 | d     |     0 |              |         |            |
       |                |       16443 |         0 | d     |     0 |              |         |            |
       |                |       16444 |         0 | d     |     0 |              |         |            |
       |                |       16445 |         0 | d     |     0 |              |         |            |
 16544 | pg_aoseg_16542 |       16439 |     32768 | a     |     0 |         6104 | o       | h          |        16542
 16542 | aoro           |       16438 | 333860888 | a     |     0 |         2200 | r       | a          |
       |                |       16442 |         0 | d     |     1 |              |         |            |
       |                |       16443 |         0 | d     |     1 |              |         |            |
       |                |       16444 |         0 | d     |     1 |              |         |            |
       |                |       16445 |         0 | d     |     1 |              |         |            |
 16544 | pg_aoseg_16542 |       16439 |     32768 | a     |     1 |         6104 | o       | h          |        16542
 16542 | aoro           |       16438 | 333829336 | a     |     1 |         2200 | r       | a          |
(23 rows)
Update the metrics and check the changes (to reduce the amount of output, filter by the public scheme and relnamespace = 2200):
postgres=# SELECT public.collect_track();
 collect_track
---------------

(1 row)

postgres=# SELECT * FROM table_sizes WHERE relnamespace = 2200;
toprelid |         relname         |    relkind     |         relstorage         | relnamespace | total_size
----------+-------------------------+----------------+----------------------------+--------------+------------
    16542 | aoro                    | ordinary table | append only storage        |         2200 | 1001824688
(1 row)
As can be seen from the updated track, the size of the aoro table has been updated, and the aoco table has disappeared from the selection, since it was deleted.
In order to periodically request a track and update metrics, I suggest using the pg_cron extension:
postgres=# CREATE EXTENSION IF NOT EXISTS pg_cron;
SELECT cron.schedule('vacuum_track', '0 10 * * *', 'VACUUM adb_tables_track_snapshot');
SELECT cron.schedule('collect_track', '30 seconds', 'SELECT collect_track()');

postgres=# SELECT * FROM cron.job_run_details ORDER BY start_time DESC LIMIT 5;
 jobid | runid | job_pid | database | username |        command         |  status   | return_message |          start_time           |           end_time
-------+-------+---------+----------+----------+------------------------+-----------+----------------+-------------------------------+-------------------------------
     2 |     4 |  185730 | postgres | andrey   | SELECT collect_track() | succeeded | 1 row          | 2025-01-24 18:21:17.044724+03 | 2025-01-24 18:21:17.096463+03
     2 |     3 |  185688 | postgres | andrey   | SELECT collect_track() | succeeded | 1 row          | 2025-01-24 18:20:47.044481+03 | 2025-01-24 18:20:47.103201+03
     2 |     2 |  185660 | postgres | andrey   | SELECT collect_track() | succeeded | 1 row          | 2025-01-24 18:20:17.044327+03 | 2025-01-24 18:20:17.097553+03
     2 |     1 |  185617 | postgres | andrey   | SELECT collect_track() | succeeded | 1 row          | 2025-01-24 18:19:47.043519+03 | 2025-01-24 18:19:47.102101+03
Draw Grafana dashboards
Next, I configured the source for metrics as a PostgreSQL database and created basic Grafana dashboards.
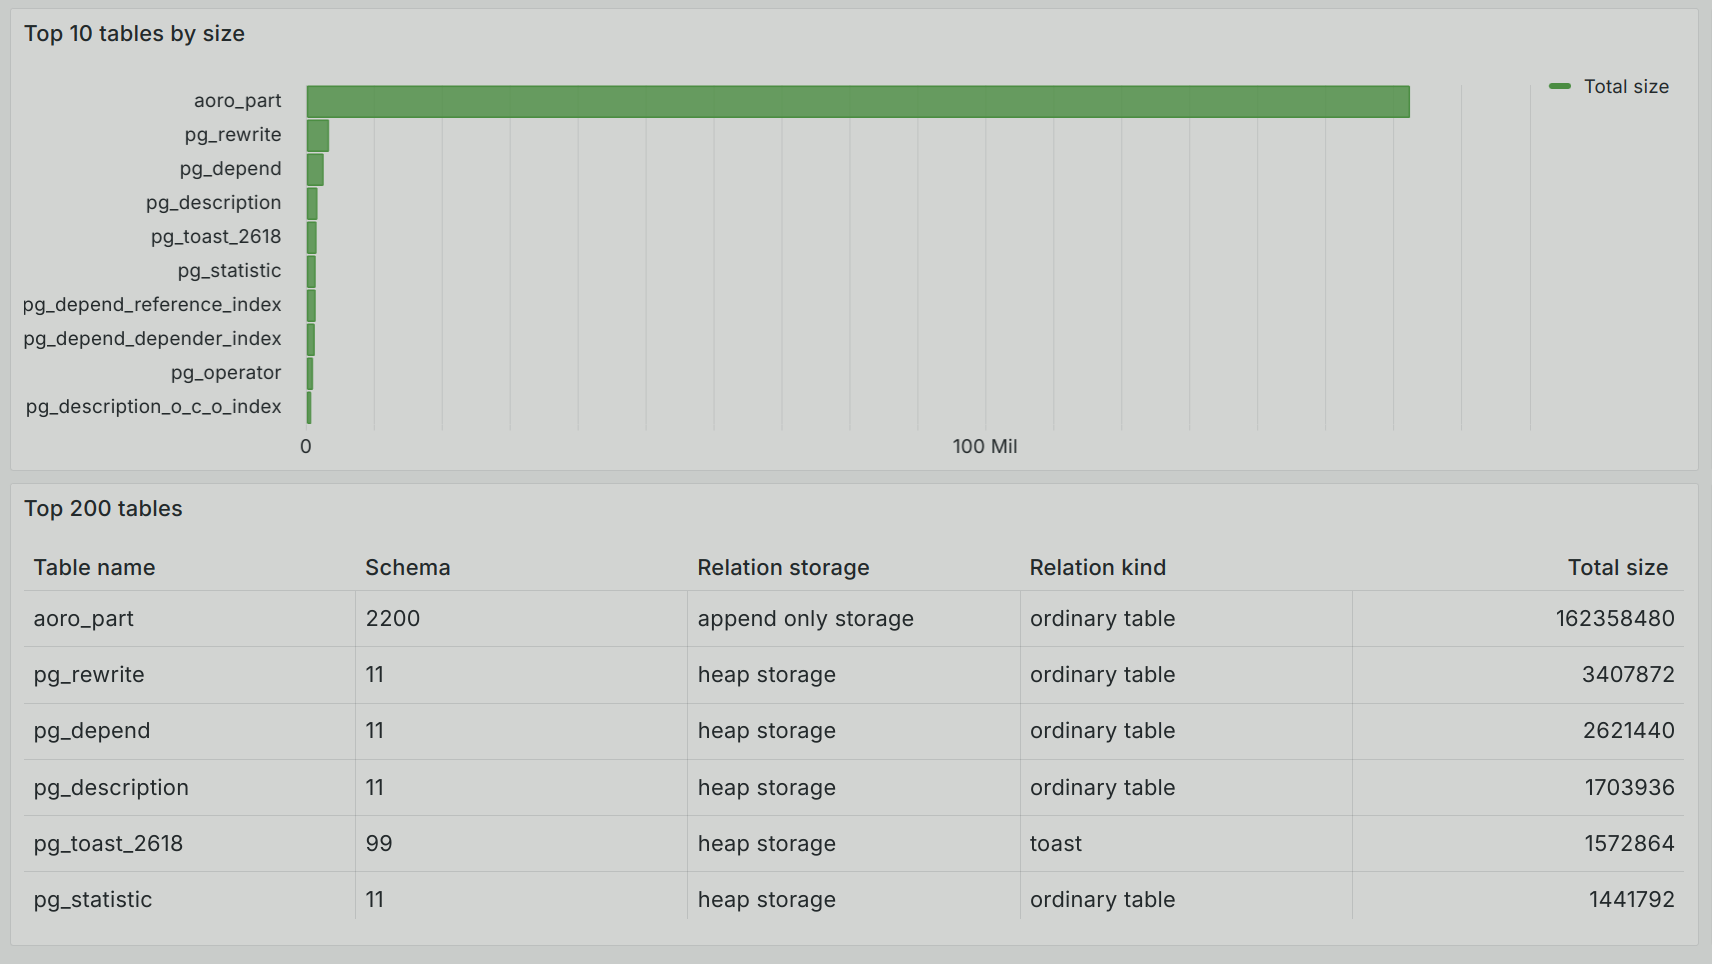
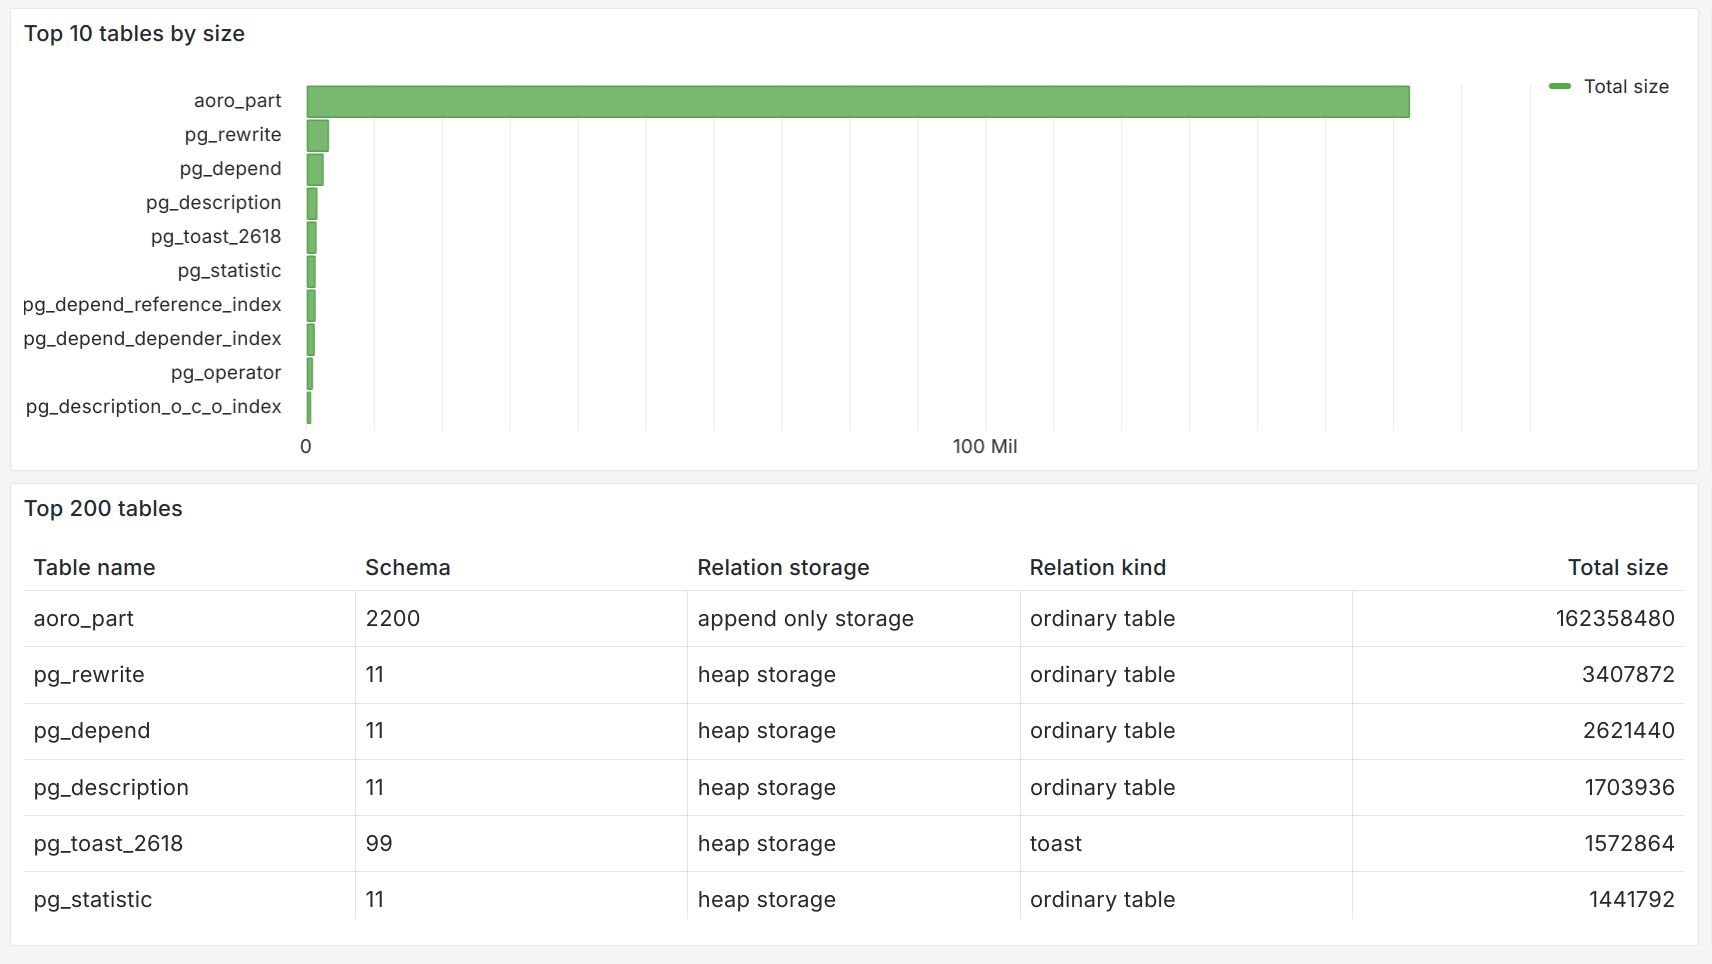
The first group is detailed by tables in the form of a common list ordered by size.
The second group, with analytics on table types (relkind), storage type (relstorage), schema distribution (relnamespace), and data distribution by segments, is extremely useful for tracking data skew.

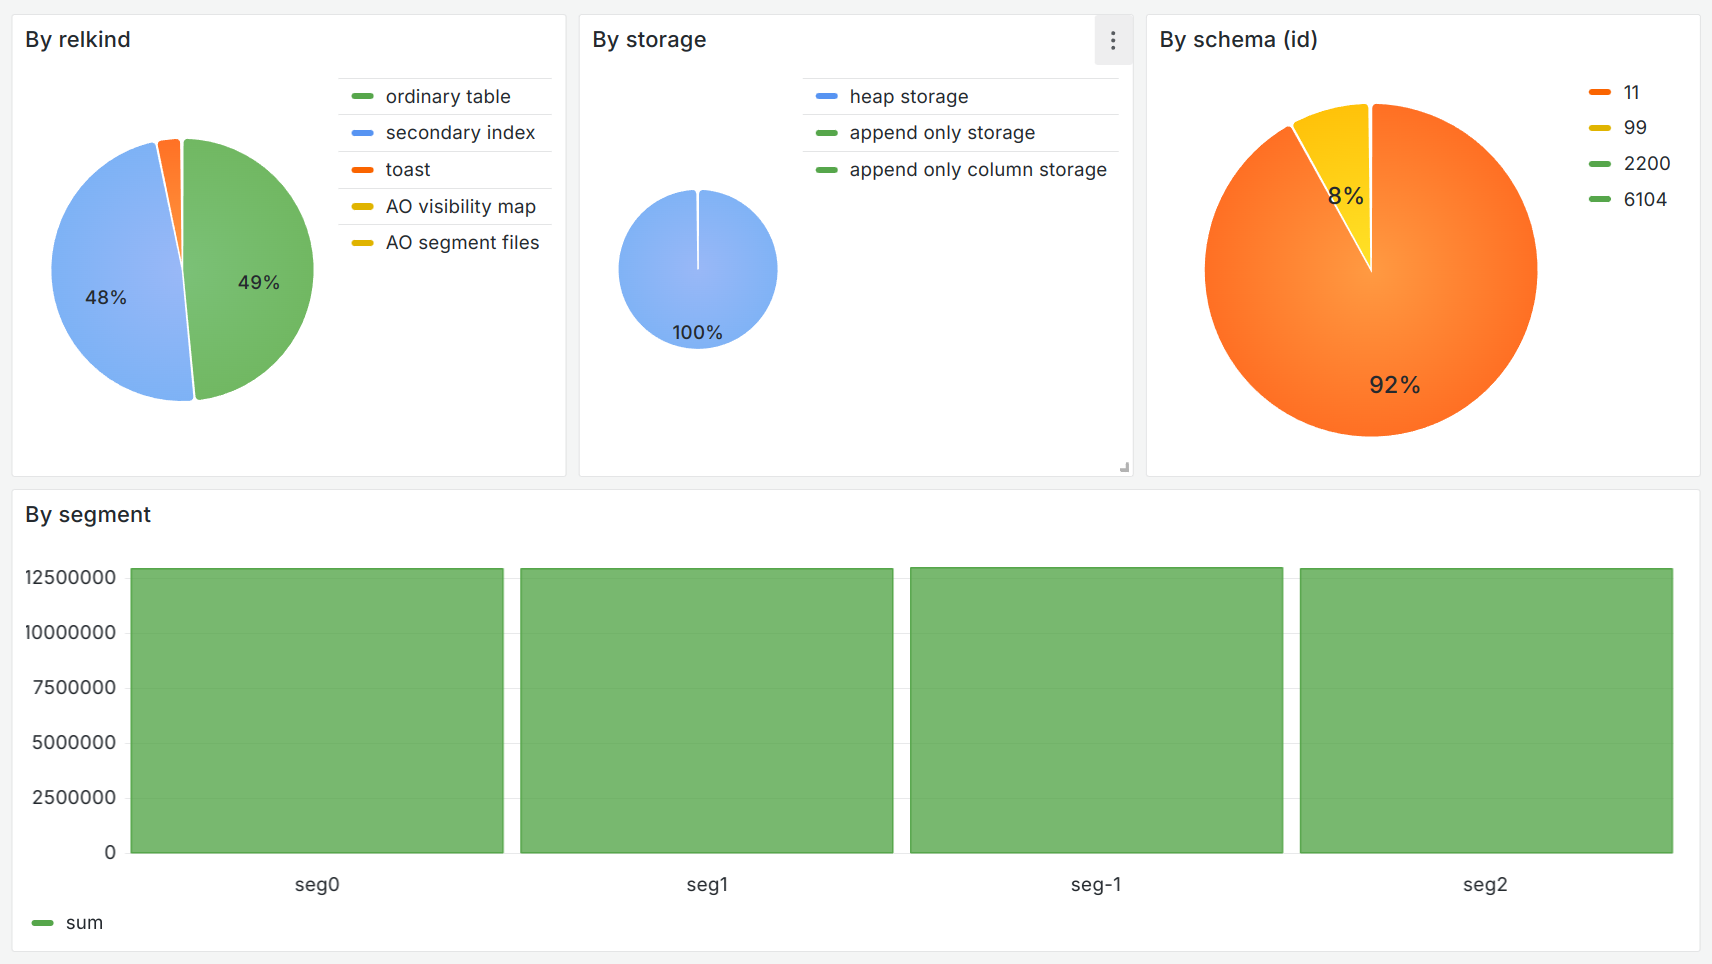
To demonstrate the data skew across segments, create a table and insert the data as follows:
andrey=# CREATE TABLE aoro_part (id INT, part INT) WITH (appendoptimized=true, orientation=row) DISTRIBUTED BY (part);
CREATE TABLE

andrey=# INSERT INTO aoro_part SELECT generate_series(1,10000), 1;
INSERT 0 10000
andrey=# INSERT INTO aoro_part SELECT generate_series(1,9000000), 2;
INSERT 0 1000000
After updating the track, you can see that the aoro_part table has taken up significantly more space.
You can also see a data skew on the first segment (seg0).
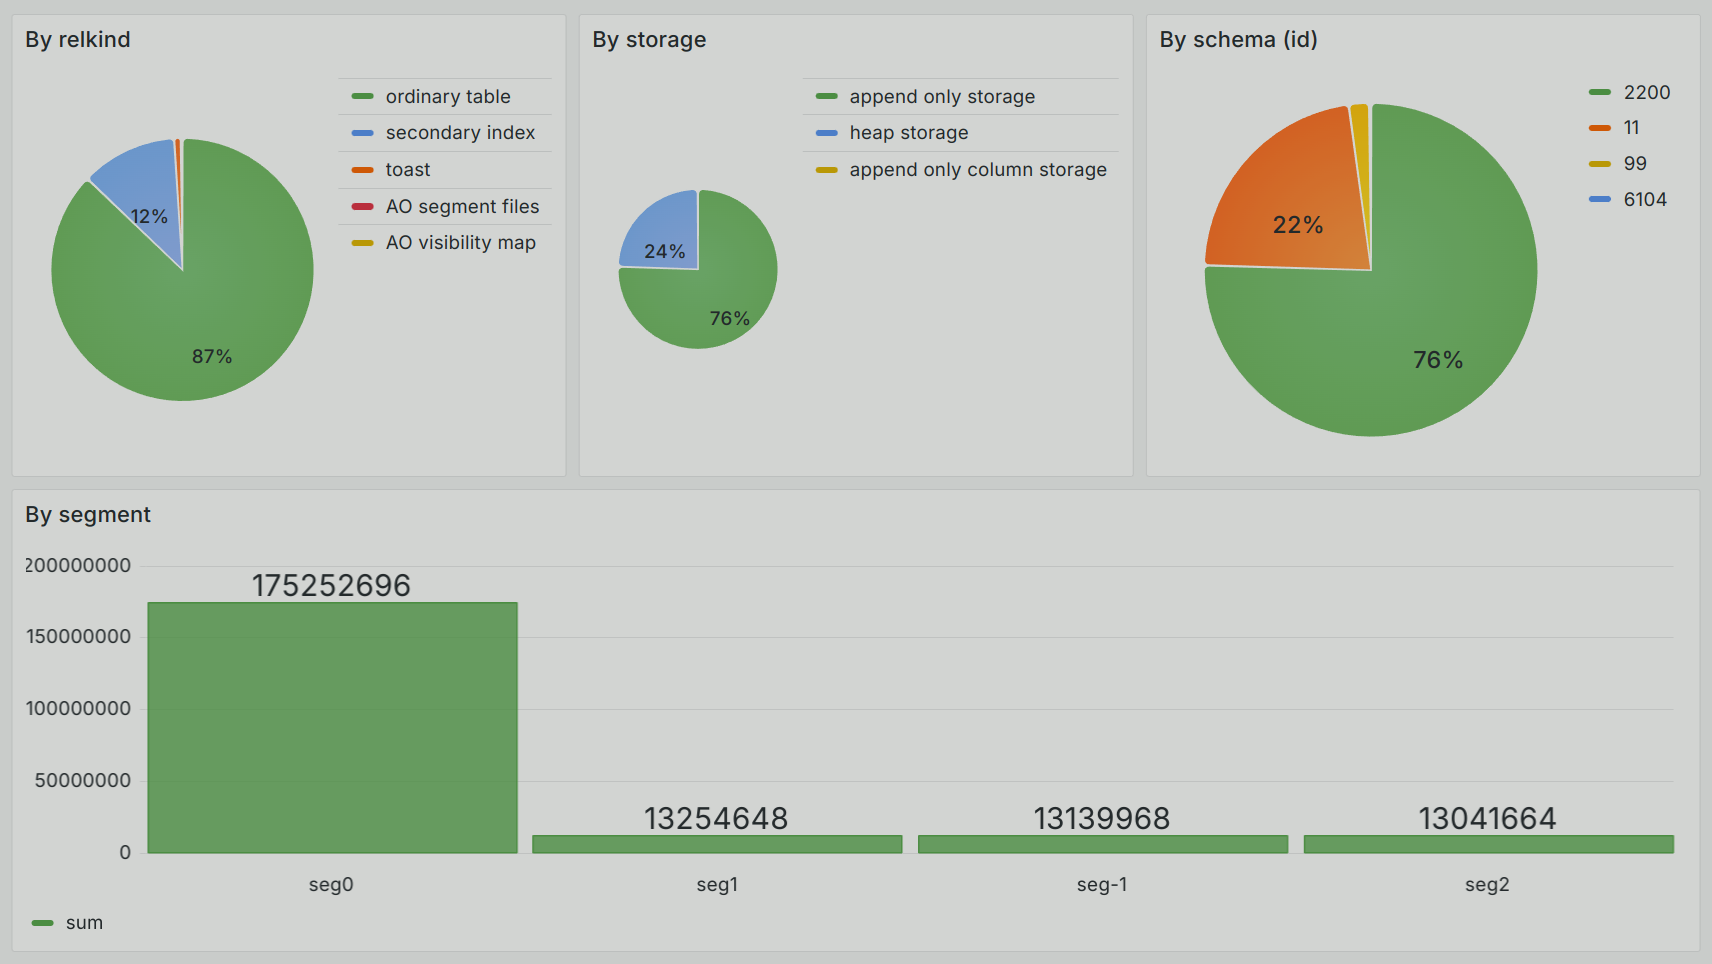
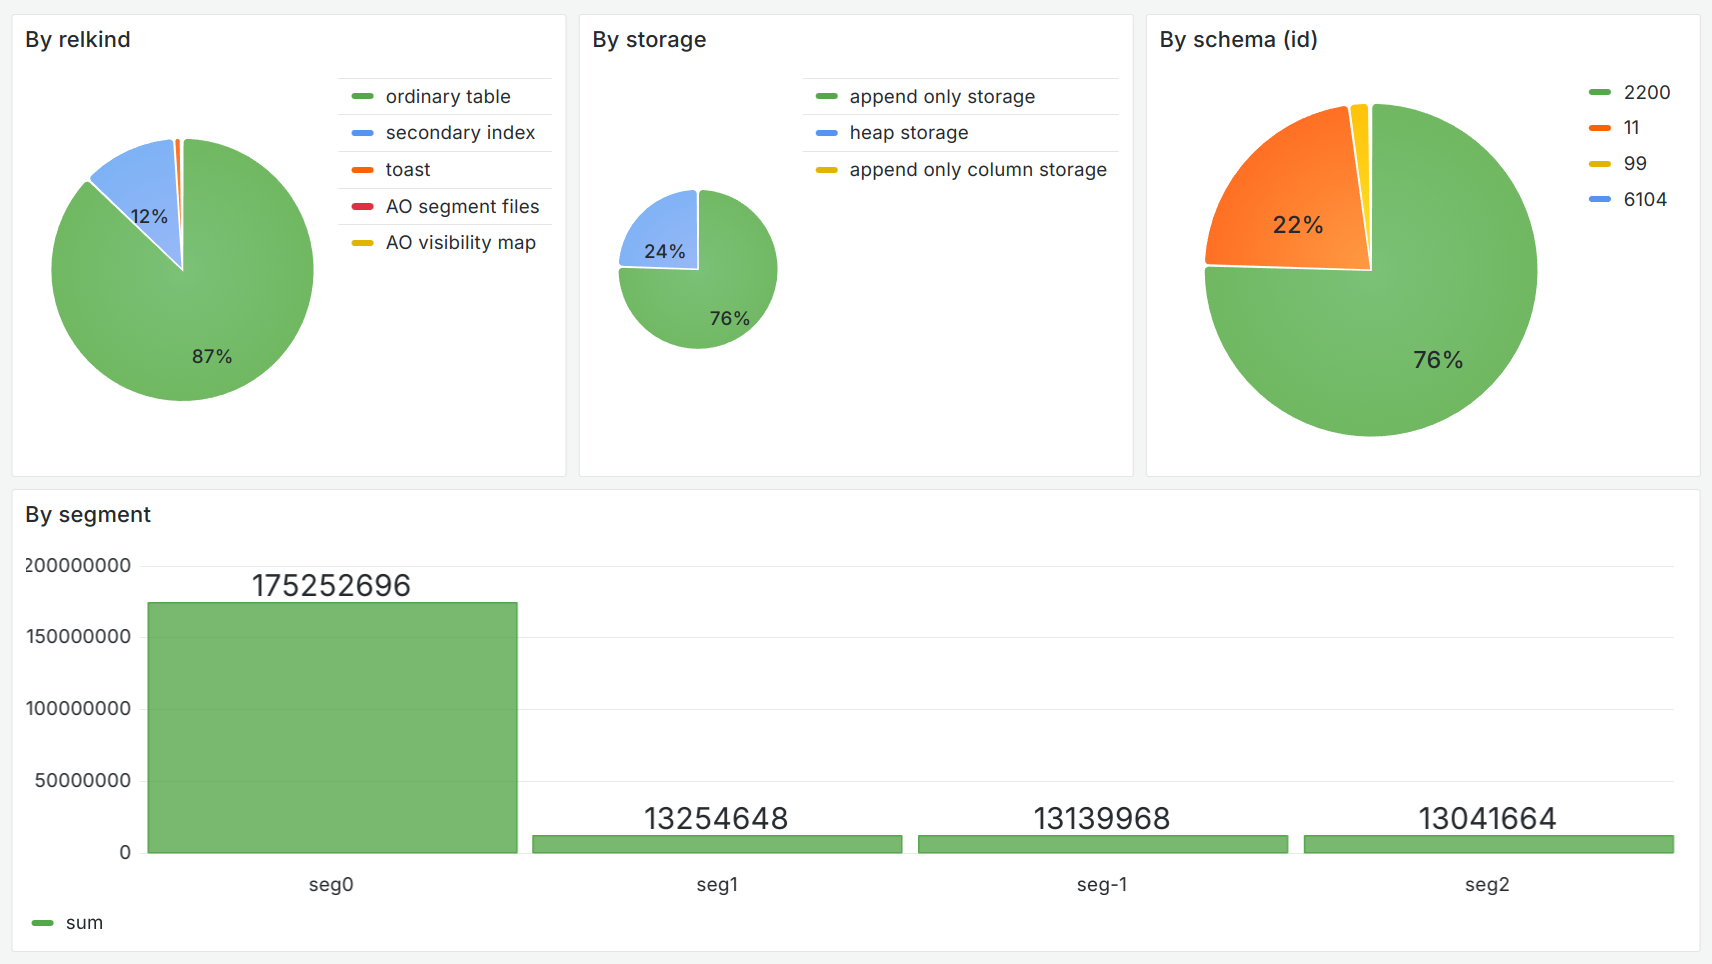
When processing data in this way, our solution can be an alternative to the gp_skew_coefficients and possibly gp_skew_idle_fractitions views.